

 Download:
Figures of the Article
-
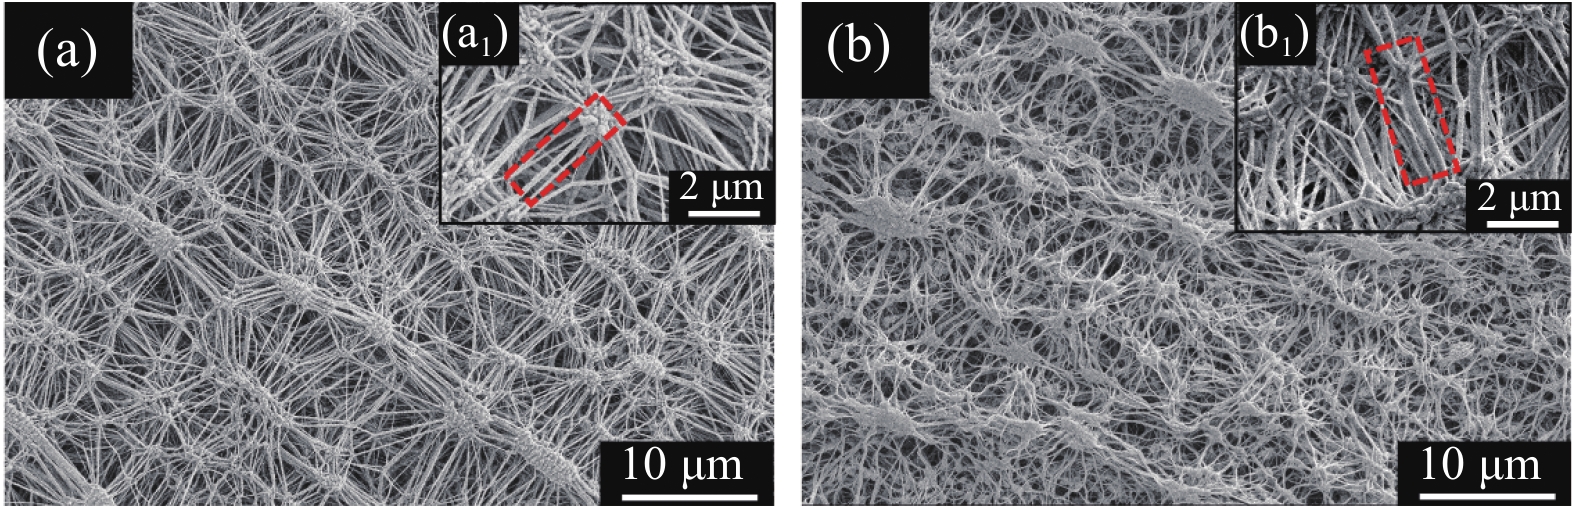
![]() FE-SEM images of PTFE fiber membrane:(a) before soaking (b) after soaking
FE-SEM images of PTFE fiber membrane:(a) before soaking (b) after soaking
-
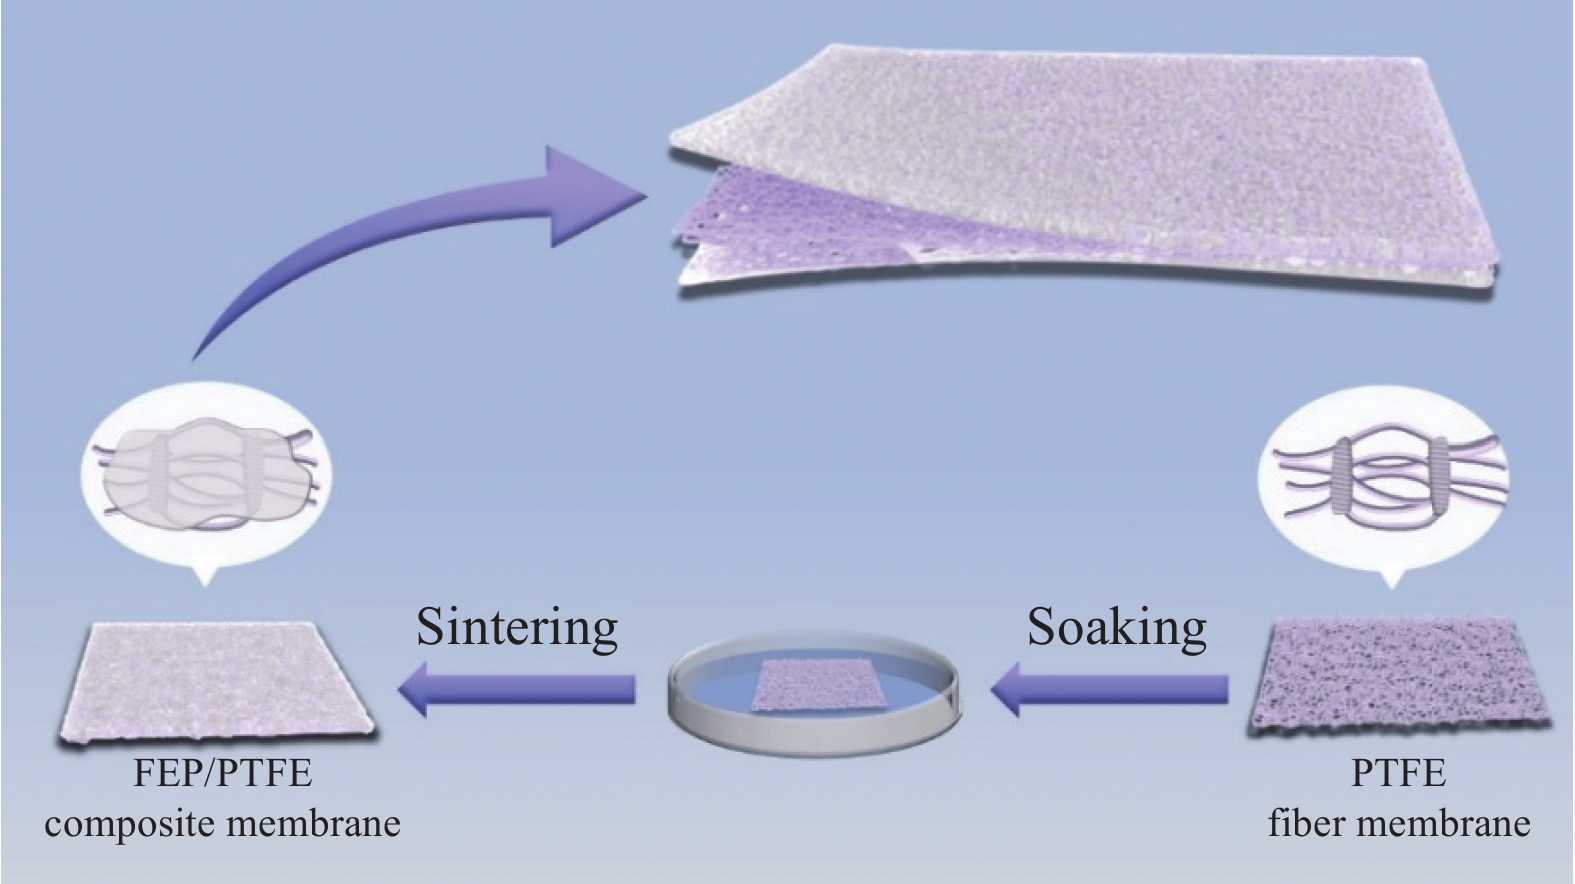
![]() Schematic diagram of FEP post-finishing PTFE
Schematic diagram of FEP post-finishing PTFE
-
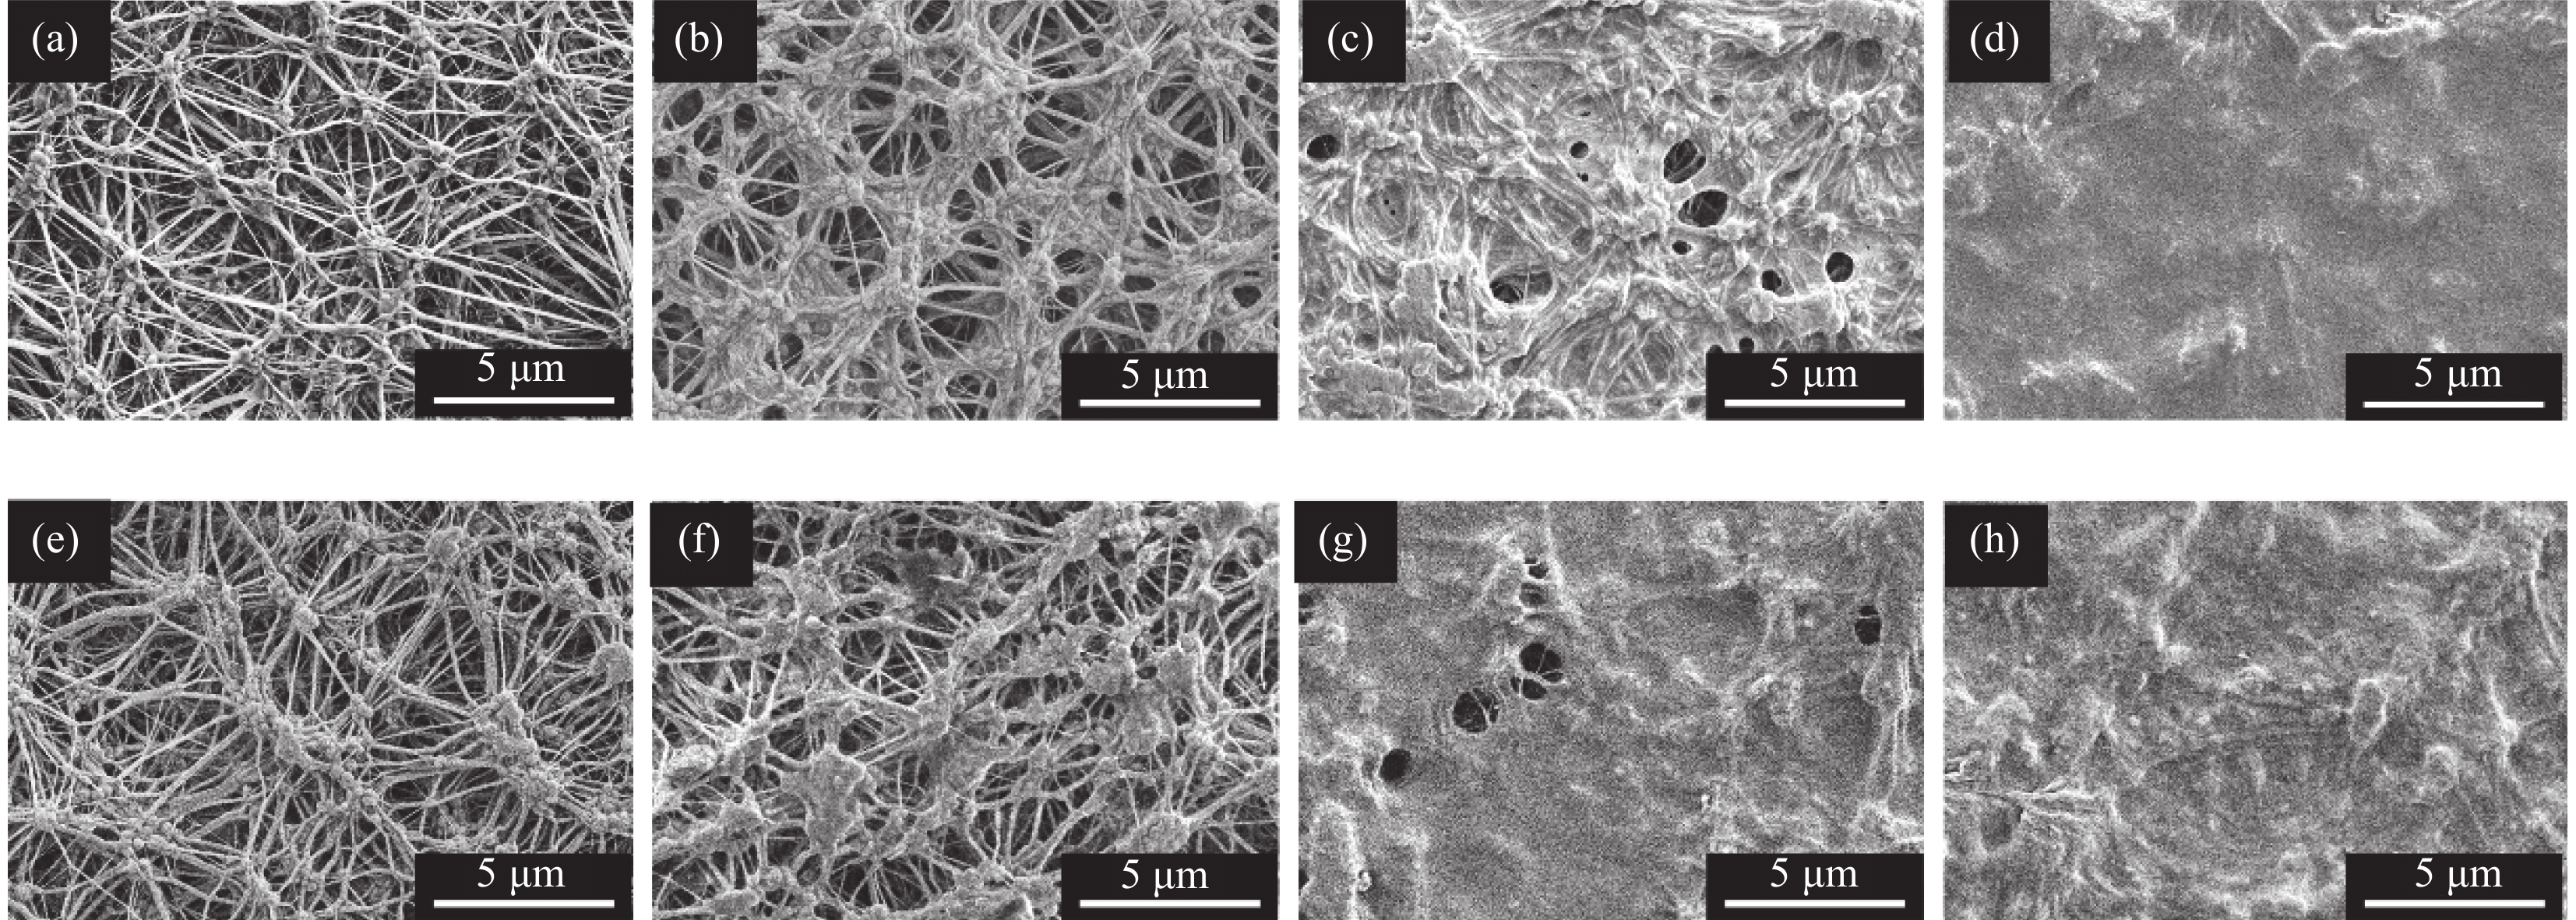
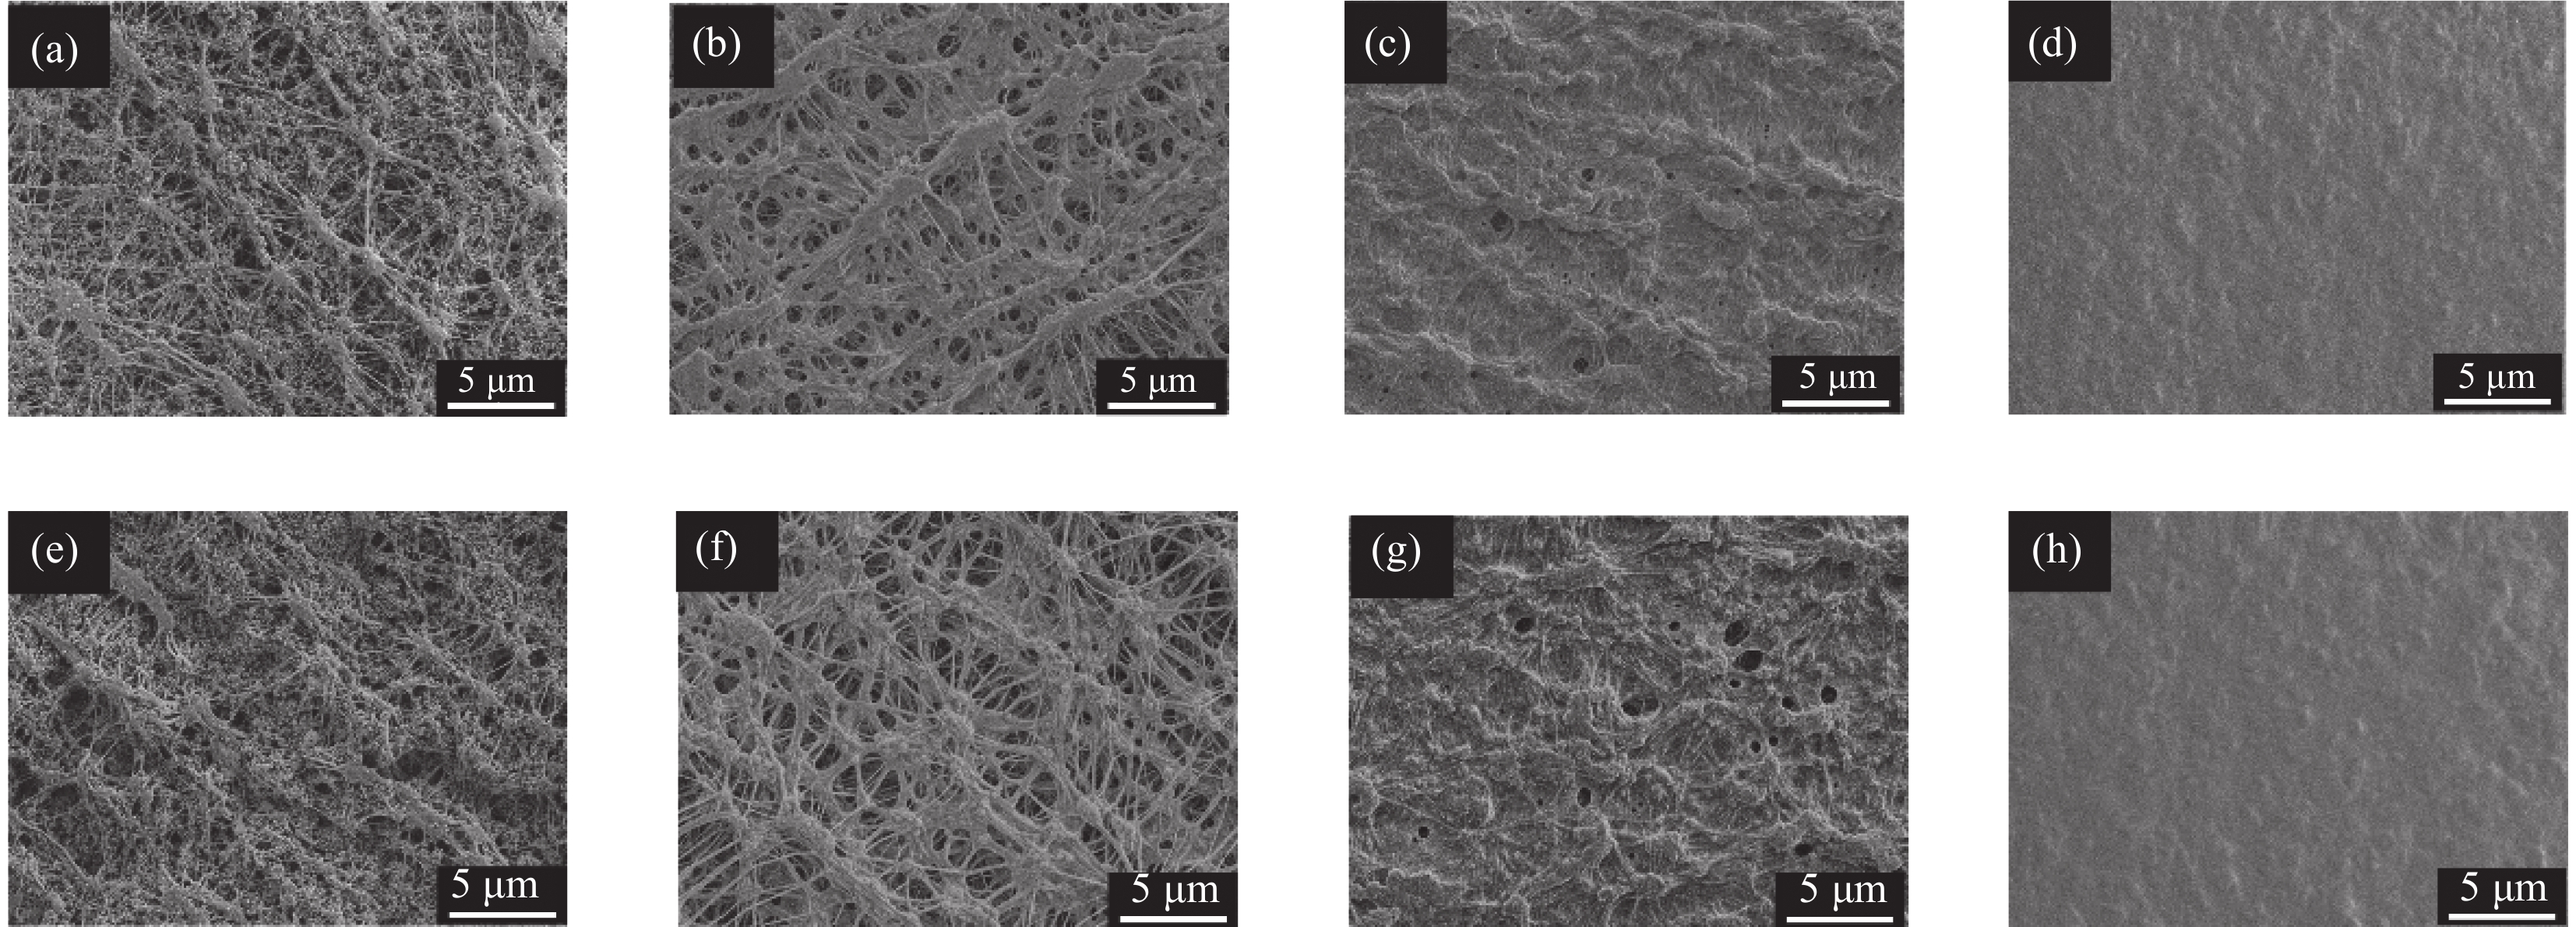
![]() FE-SEM images of composite membranes prepared with different mass fractions of FEP dispersions: (a-d): (1wt%-4wt%) FEP/PTFE; (e-h):(1wt%-4wt%) FEP/PTFE-7 d
FE-SEM images of composite membranes prepared with different mass fractions of FEP dispersions: (a-d): (1wt%-4wt%) FEP/PTFE; (e-h):(1wt%-4wt%) FEP/PTFE-7 d
-
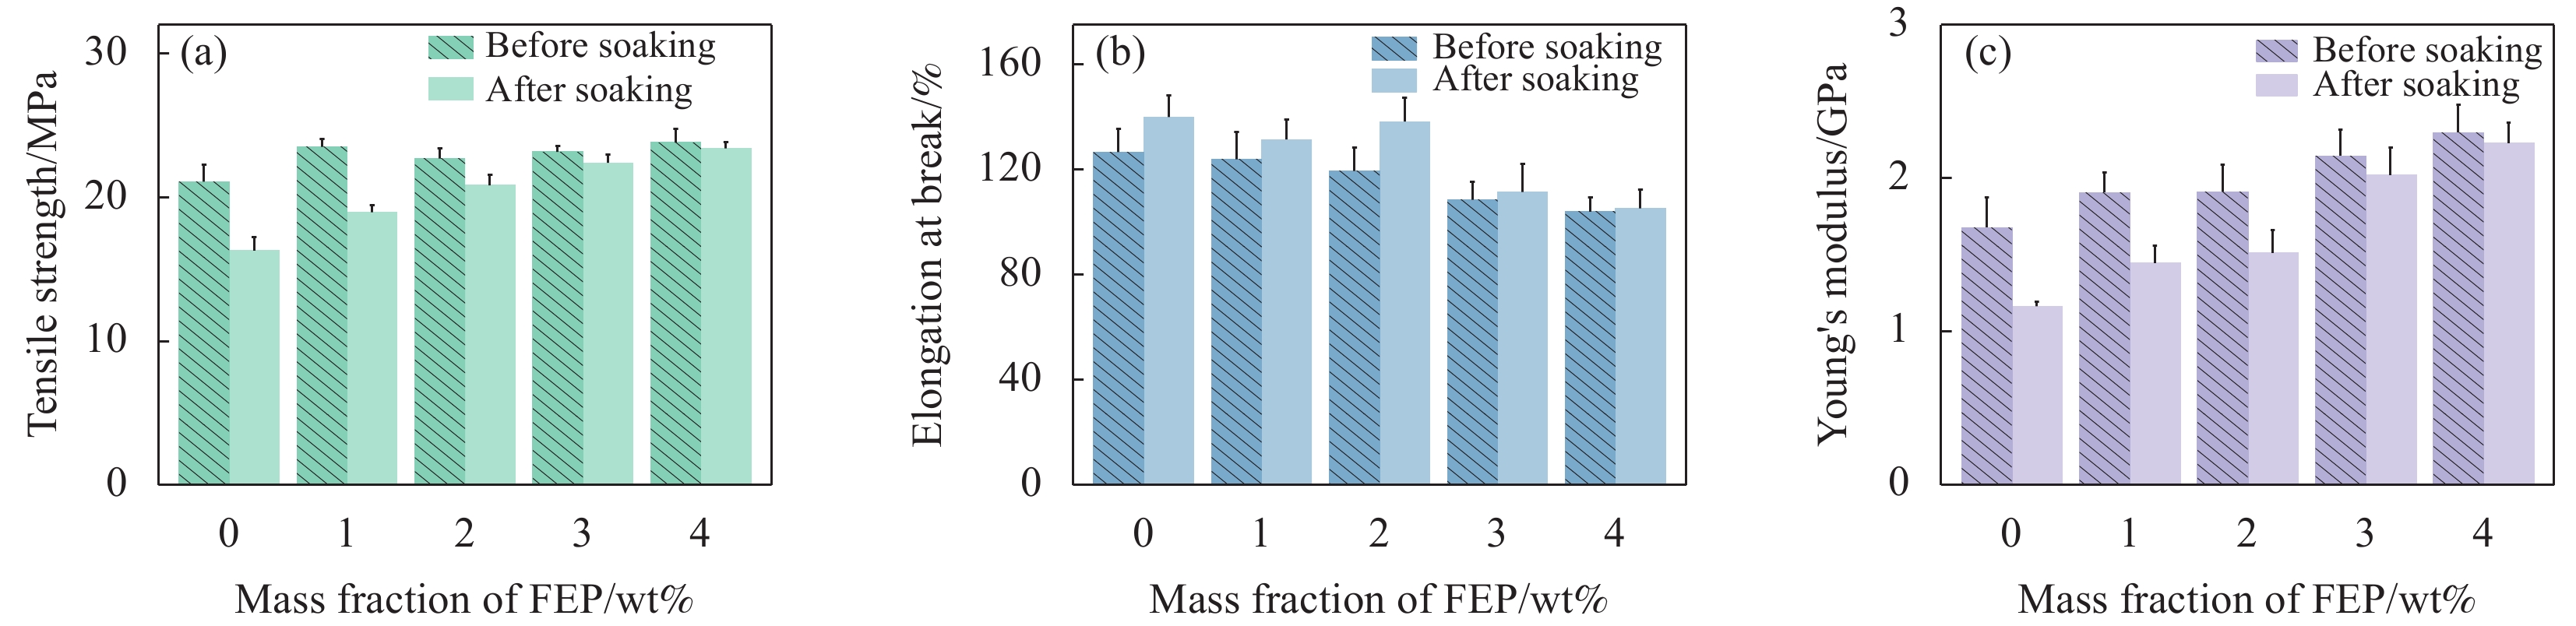
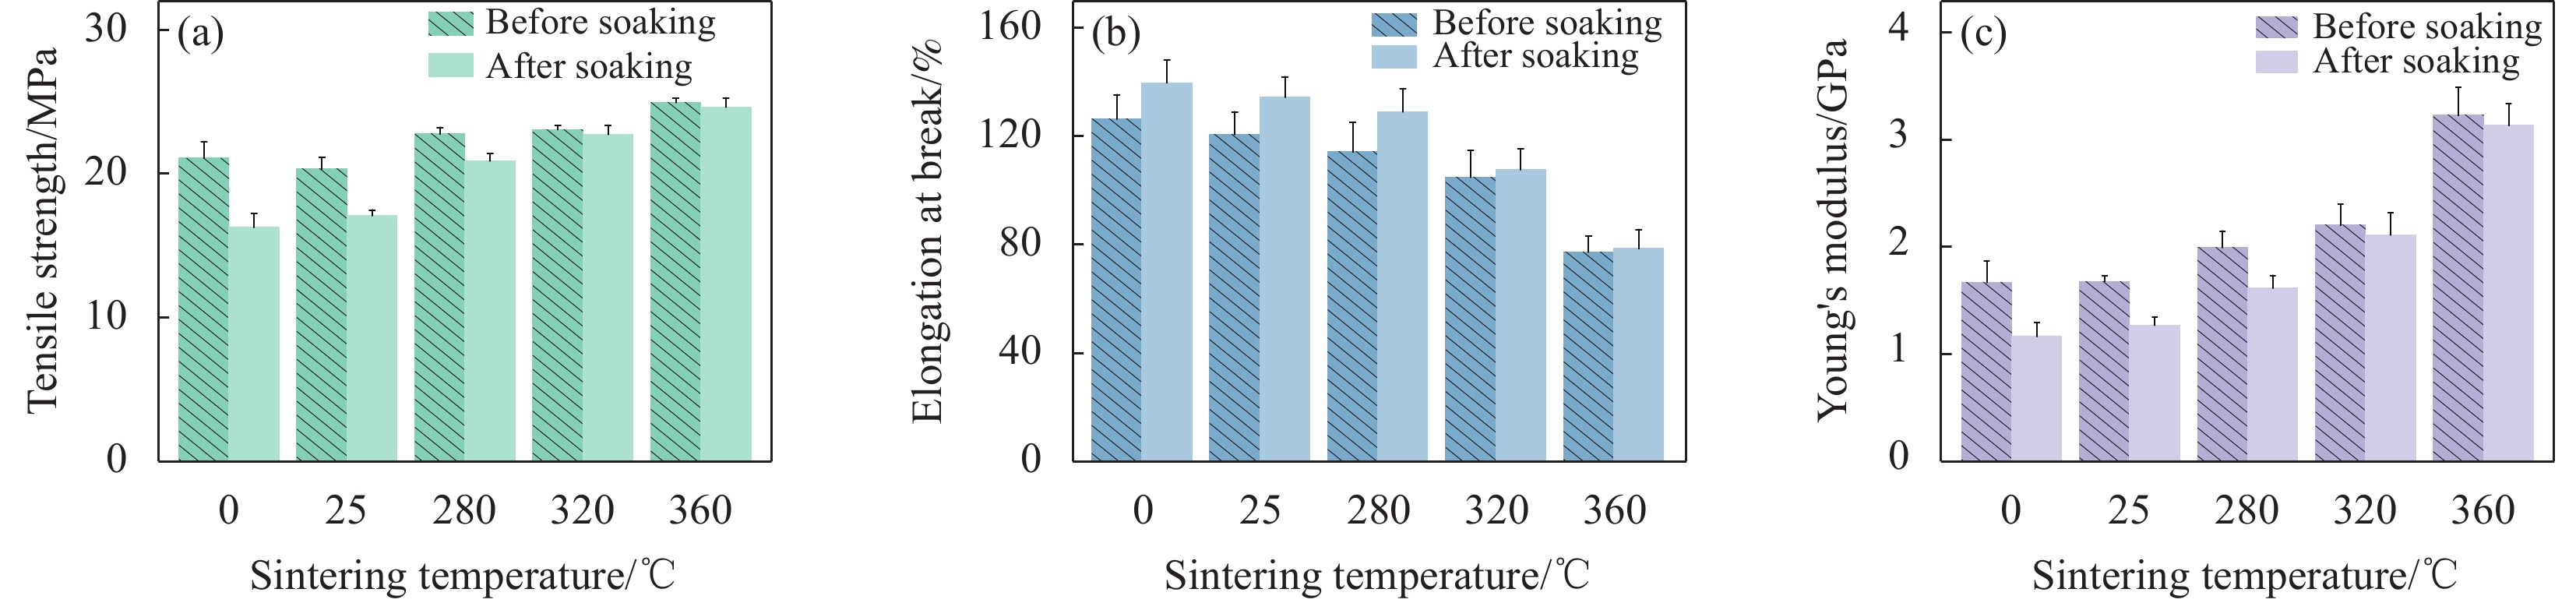
![]() Mechanical properties analysis of membrane samples with different FEP mass fractions
Mechanical properties analysis of membrane samples with different FEP mass fractions
-
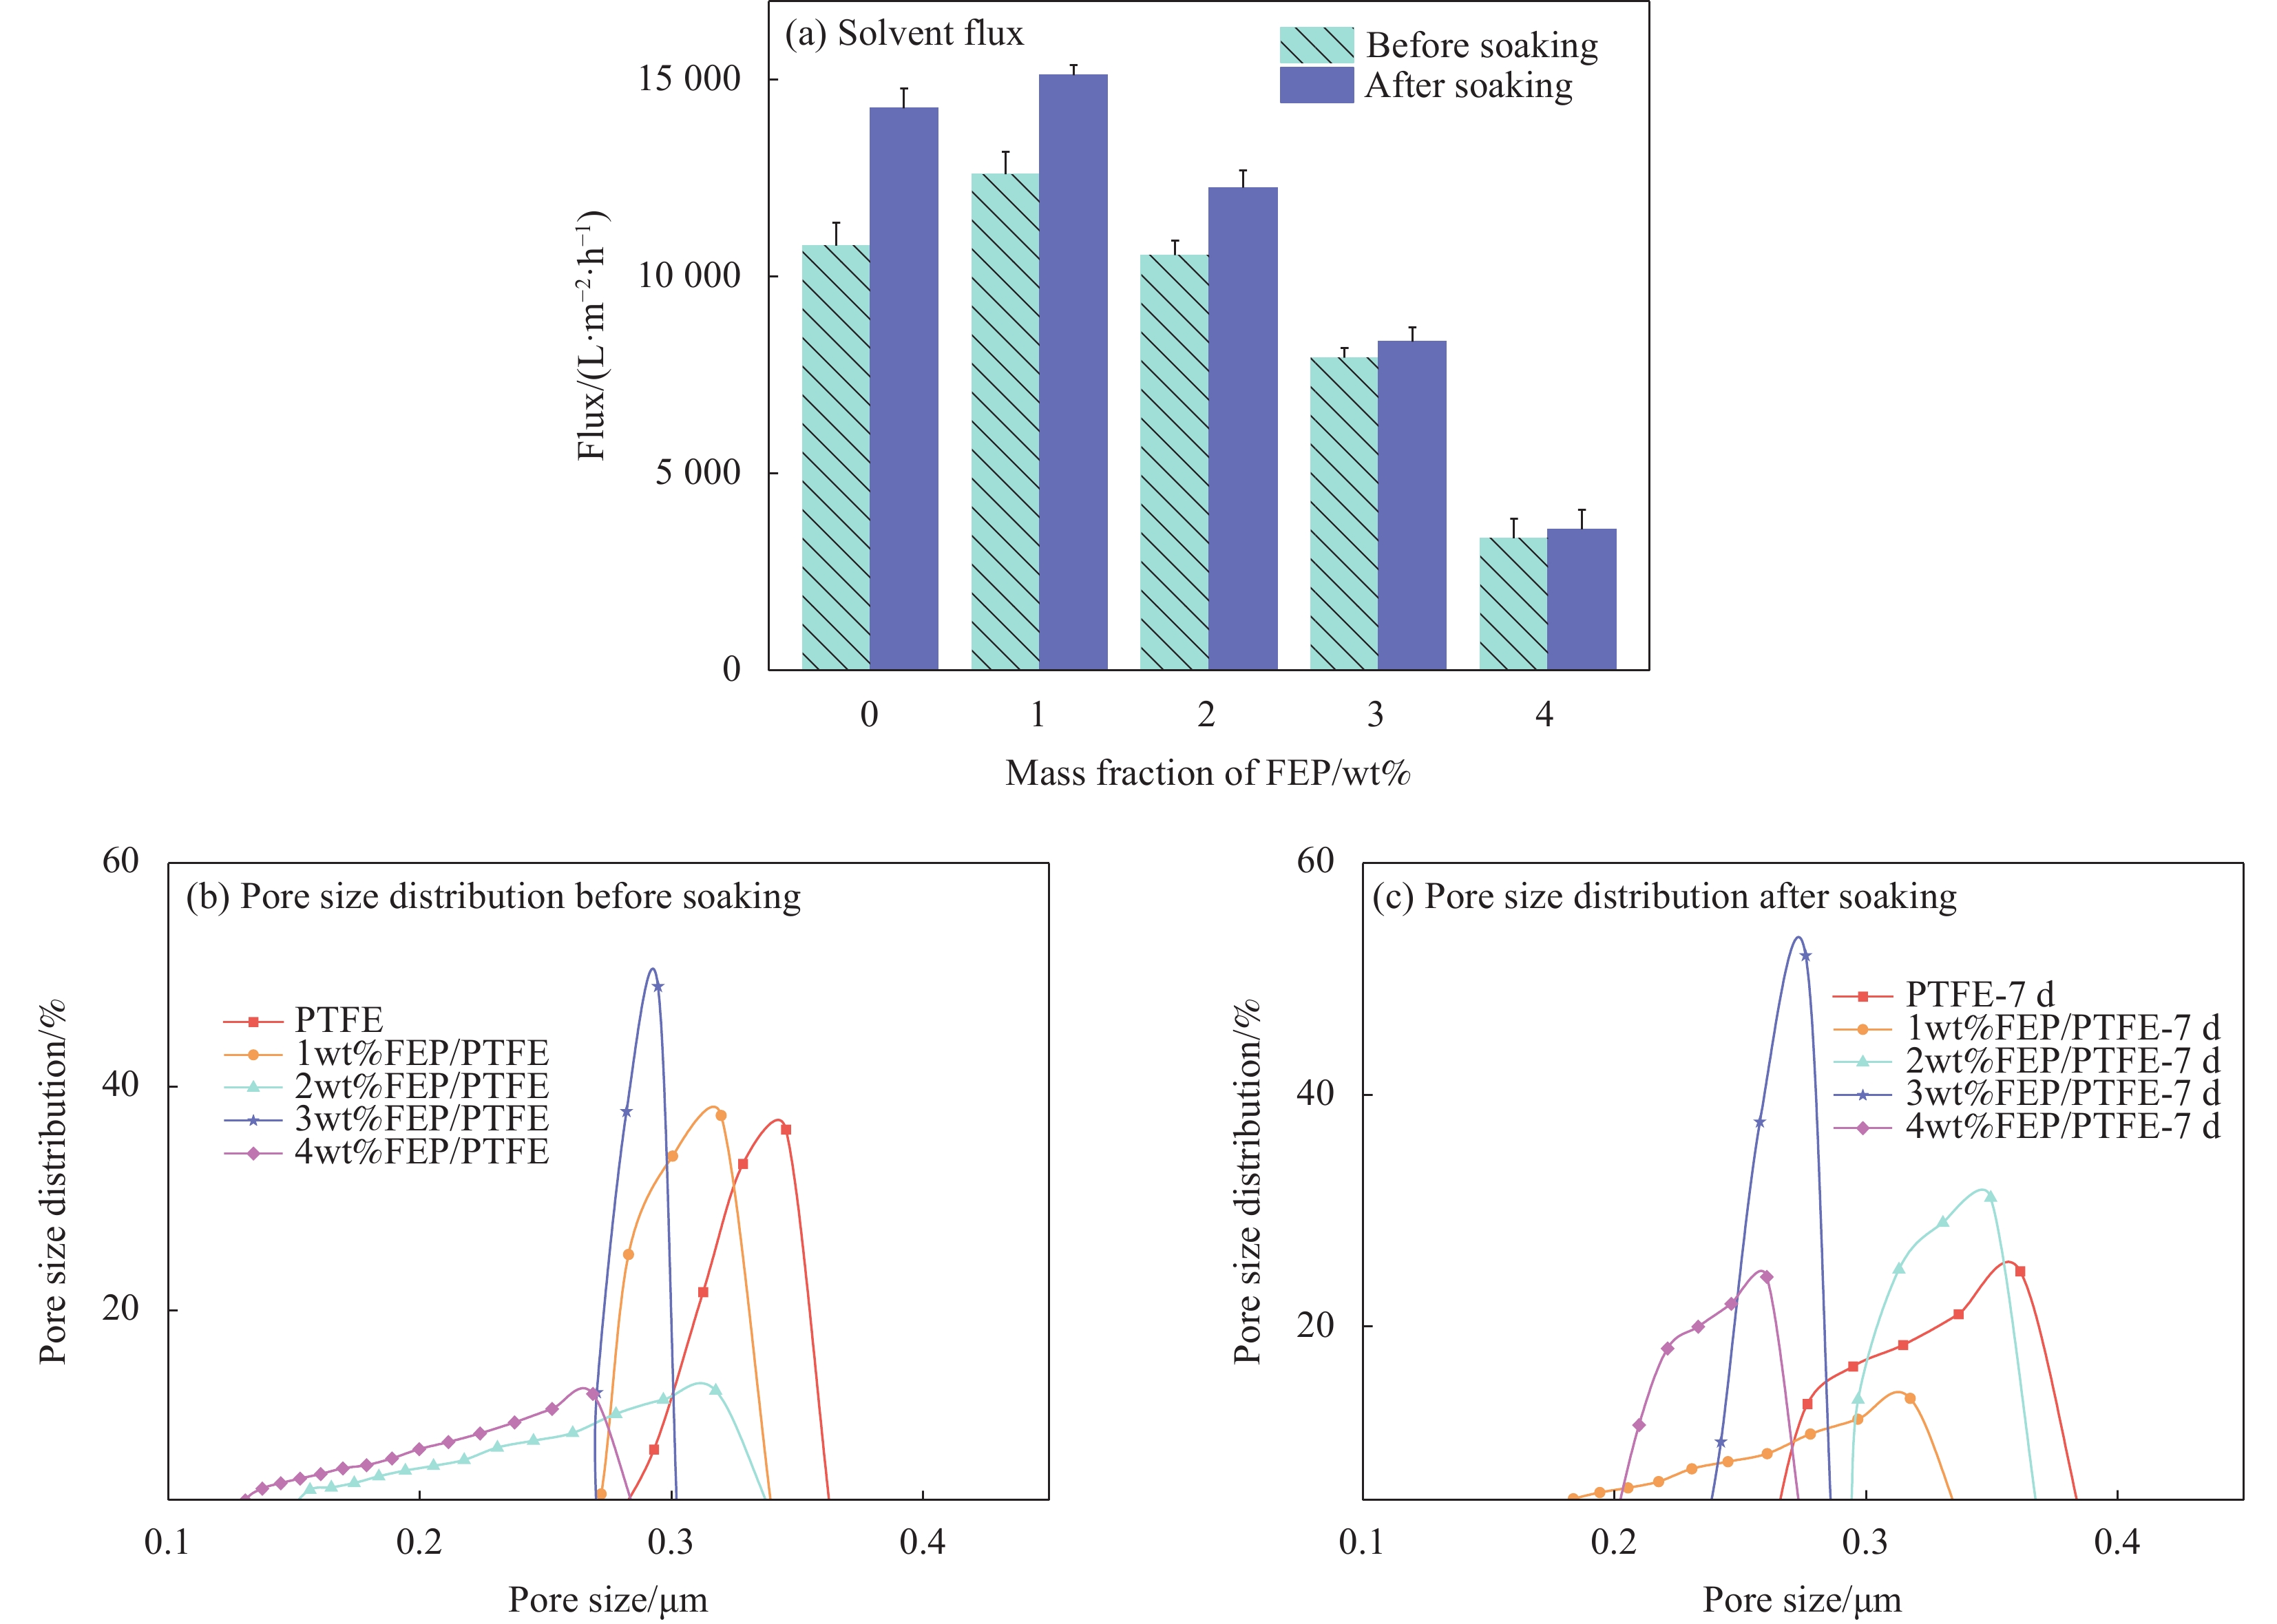
![]() Performance analysis of membrane samples with different FEP mass fractions
Performance analysis of membrane samples with different FEP mass fractions
-
![]() FE-SEM images of composite membranes at different sintering temperatures: (a-d):3wt%FEP/PTFE-(25℃-360℃);(e-h):3wt%FEP/PTFE-(25℃-360℃)-7 d
FE-SEM images of composite membranes at different sintering temperatures: (a-d):3wt%FEP/PTFE-(25℃-360℃);(e-h):3wt%FEP/PTFE-(25℃-360℃)-7 d
-
![]() Mechanical properties analysis of membrane samples at different sintering temperatures
Mechanical properties analysis of membrane samples at different sintering temperatures
-
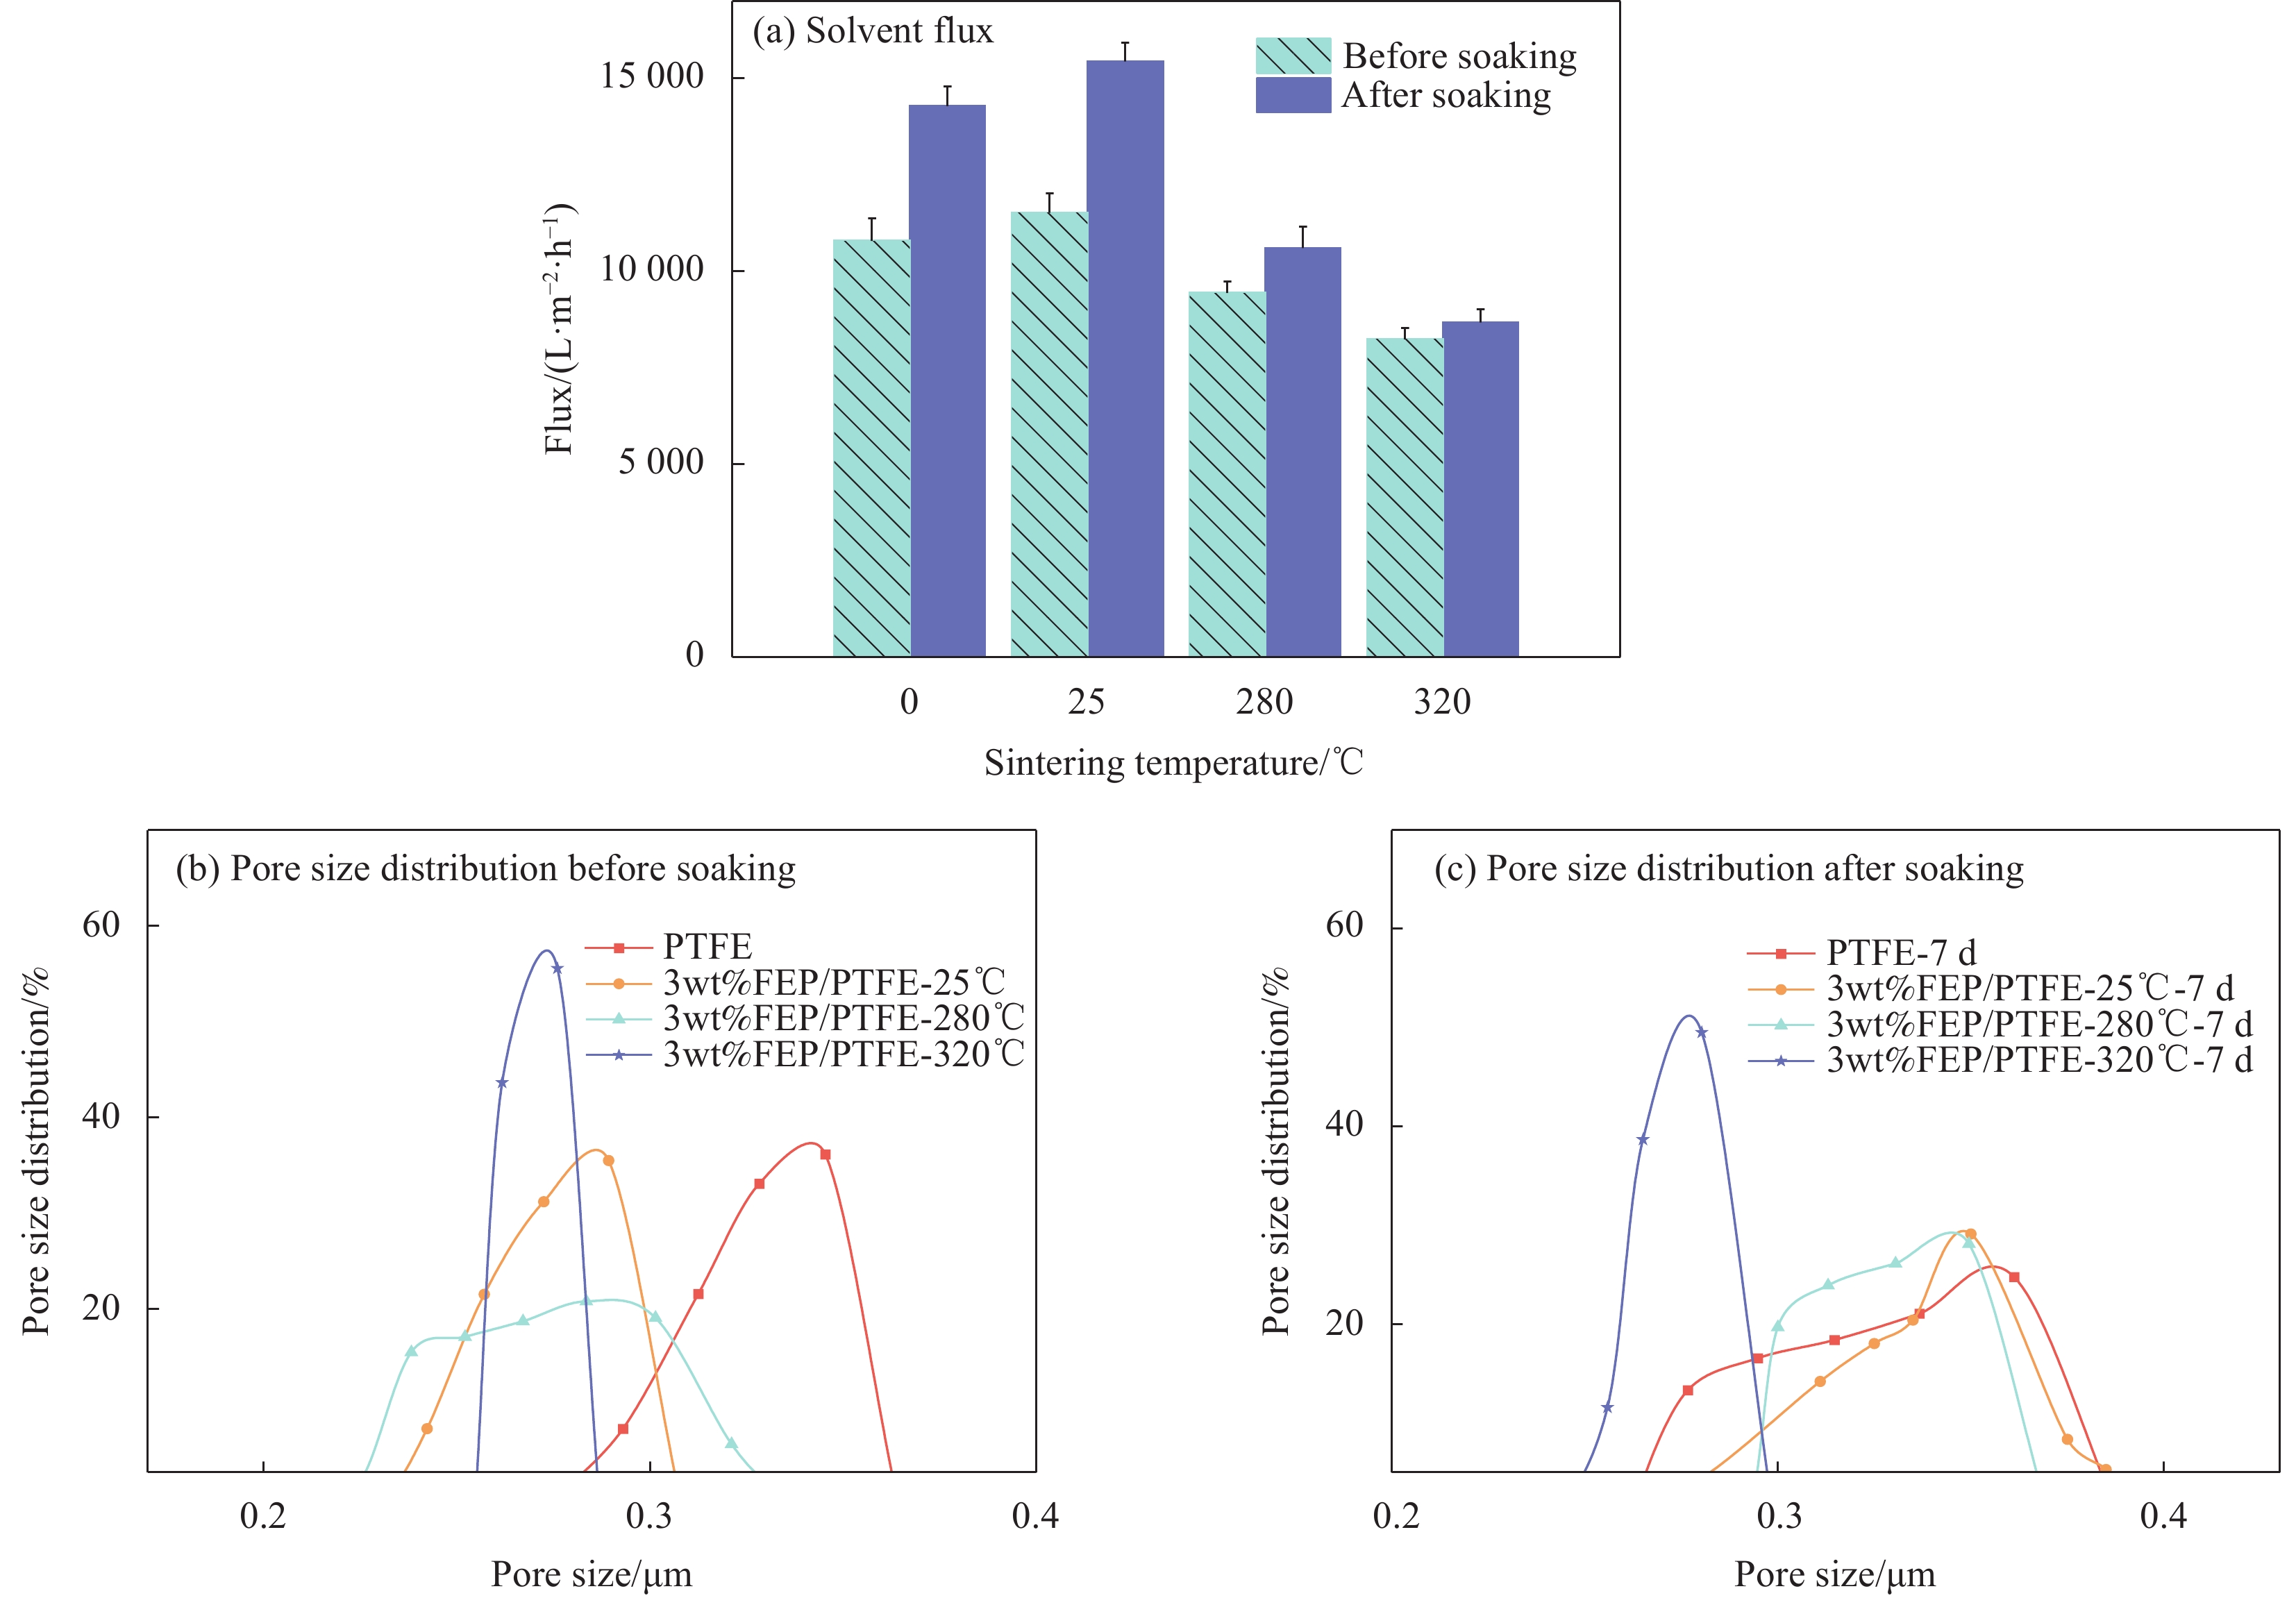
![]() Performance analysis of membrane samples at different sintering temperatures
Performance analysis of membrane samples at different sintering temperatures
-
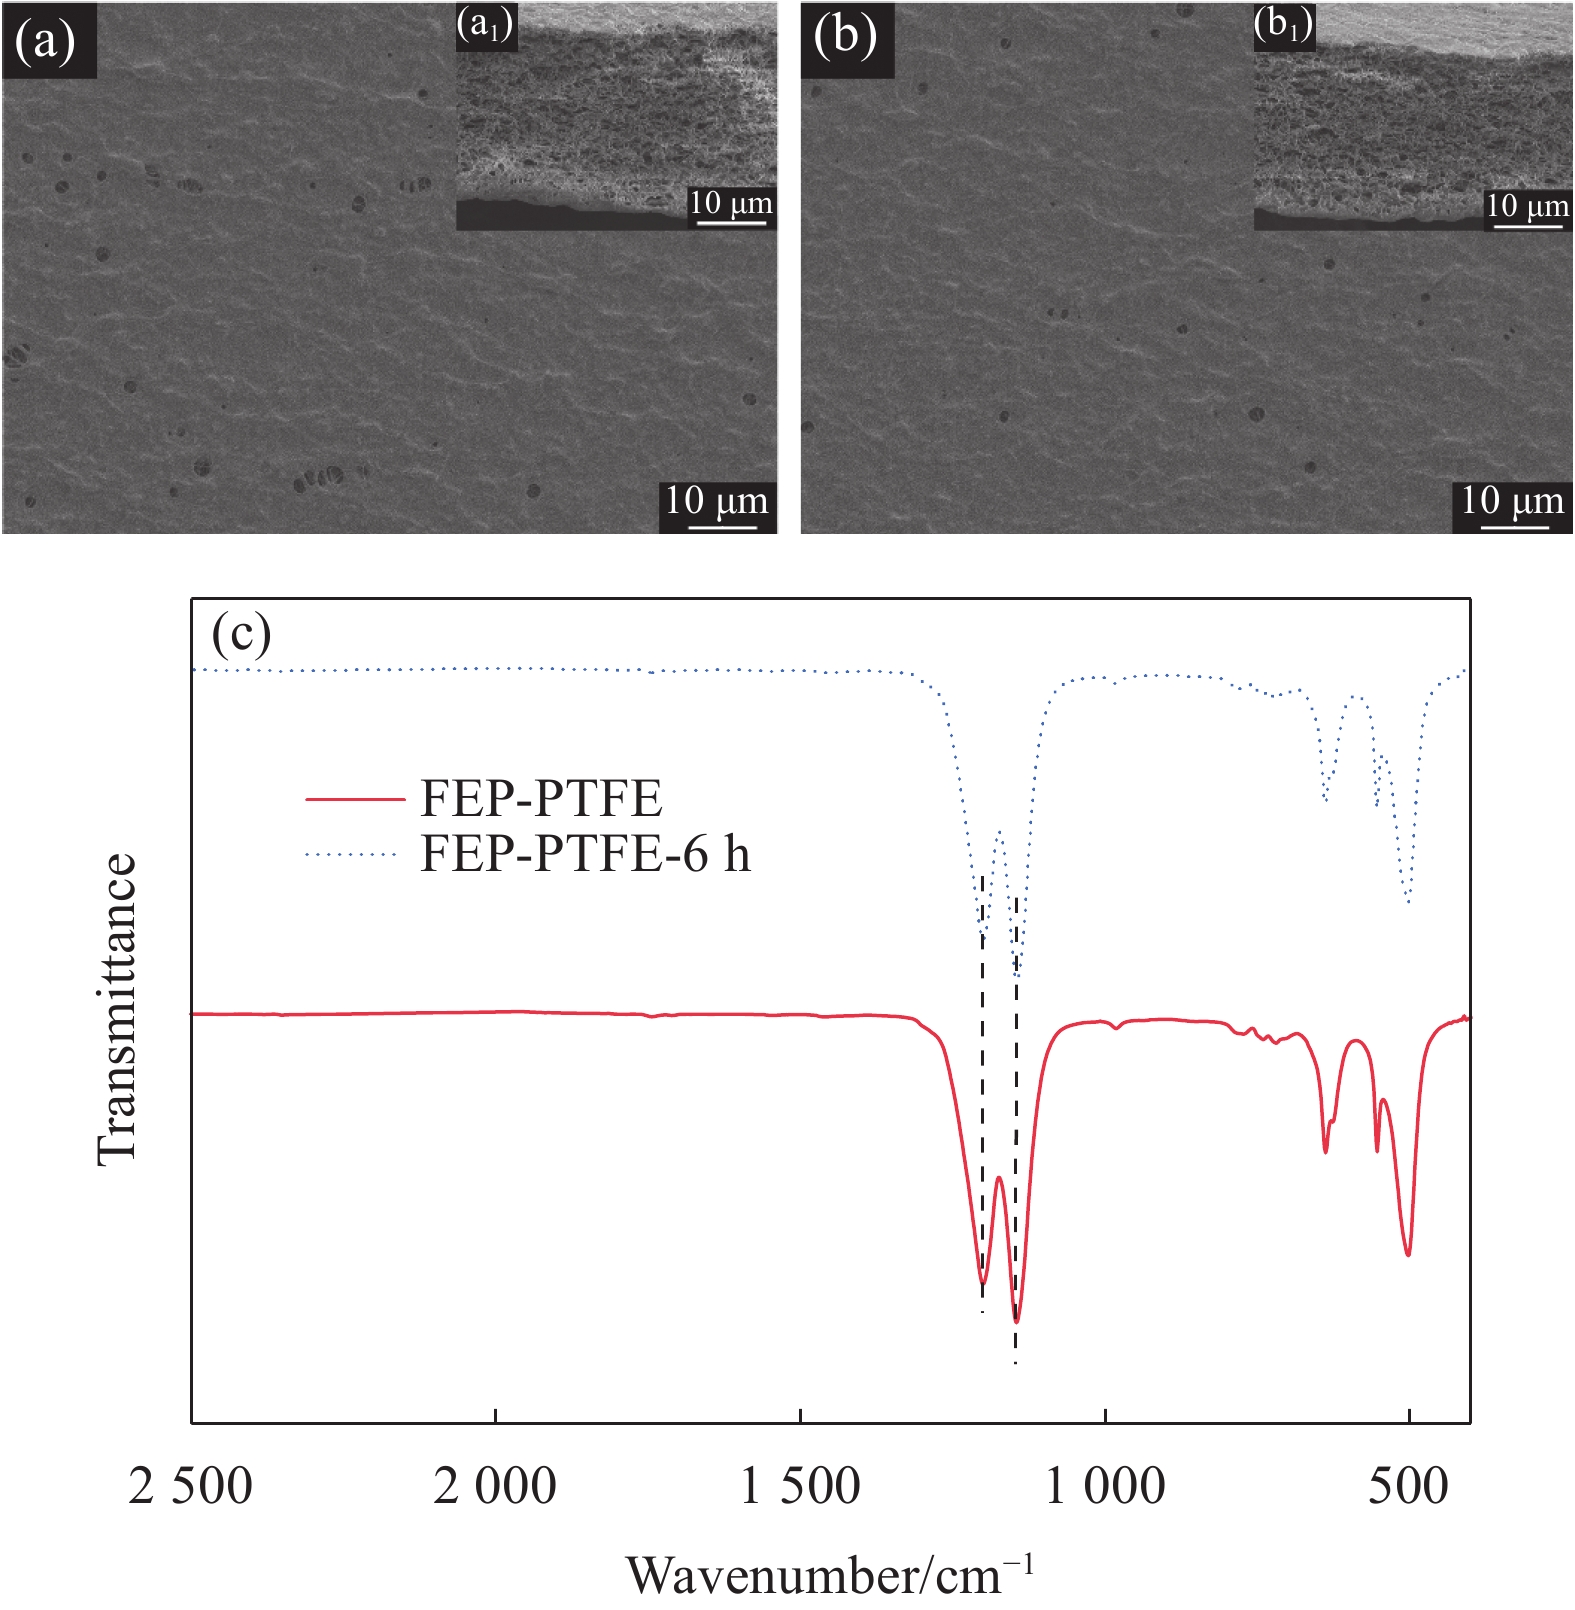
![]() Binding fastness test of FEP/PTFE composite membranes before and after ultrasonic testing (a) FE-SEM images of the primary membrane, (b) FE-SEM images of the membrane after 6 h of ultrasound, (a1、b1) FE-SEM images of Membrane cross-section,(c)Infrared spectrograms
Binding fastness test of FEP/PTFE composite membranes before and after ultrasonic testing (a) FE-SEM images of the primary membrane, (b) FE-SEM images of the membrane after 6 h of ultrasound, (a1、b1) FE-SEM images of Membrane cross-section,(c)Infrared spectrograms
-
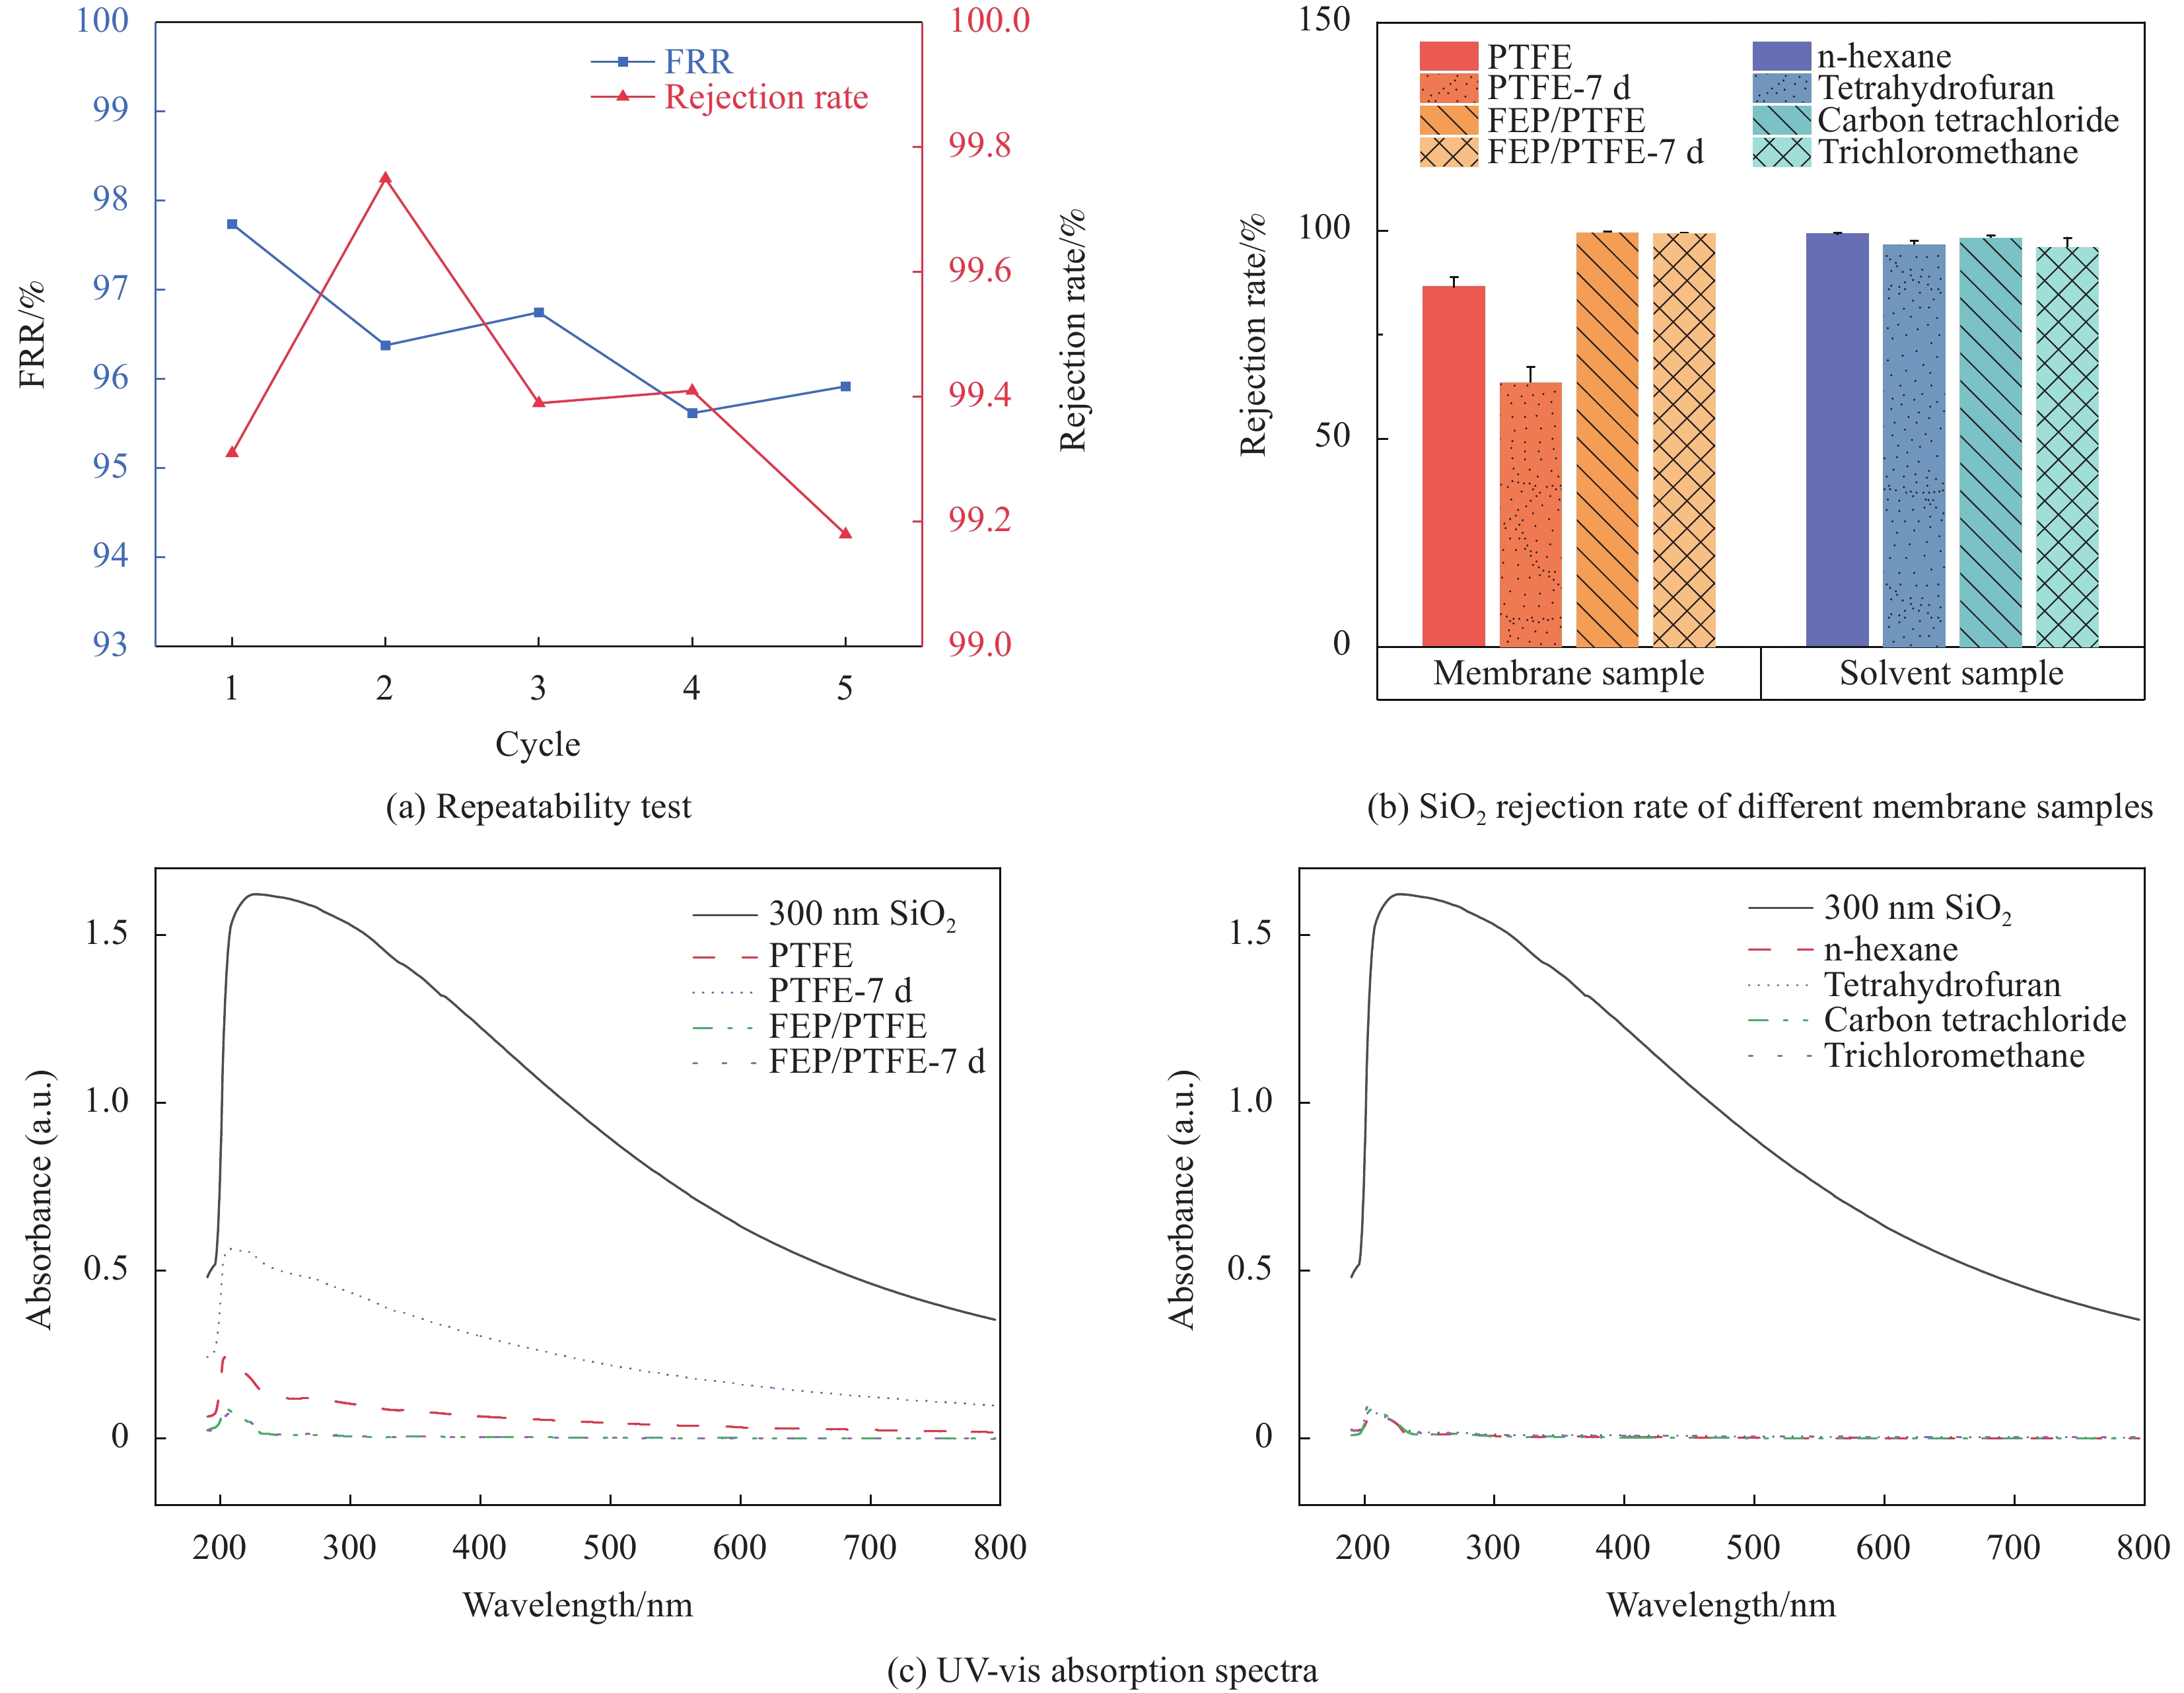
![]() Separation performance of FEP/PTFE composite membrane
Separation performance of FEP/PTFE composite membrane
Related articles
-
-
2024, 41(2): 898-910. DOI: 10.13801/j.cnki.fhclxb.20230531.004
-
2022, 39(11): 5386-5402. DOI: 10.13801/j.cnki.fhclxb.20211221.002
-
2022, 39(7): 3415-3427. DOI: 10.13801/j.cnki.fhclxb.20210804.003
-
2022, 39(5): 2356-2368. DOI: 10.13801/j.cnki.fhclxb.20210622.002
-
2022, 39(5): 2299-2307. DOI: 10.13801/j.cnki.fhclxb.20210804.002
-
2021, 38(7): 2359-2369. DOI: 10.13801/j.cnki.fhclxb.20200916.001
-
2018, 35(12): 3508-3516. DOI: 10.13801/j.cnki.fhclxb.20180211.002
-
2018, 35(8): 2222-2234. DOI: 10.13801/j.cnki.fhclxb.20171109.001
-
1993, 10(2): 17-24.
