

Sensitivity performance prediction and optimisation of flexible pressure sensing unit based on RSM and SVR-IDBO
-
摘要:
为优化柔性压力传感单元制备工艺,提升传感器灵敏度特性。本文通过建立灵敏度解析模型,确定了影响其性能表现的主要因素,采用机械共混的方式,通过调节碳纳米管(CNT)、多层石墨烯(MLG)、搅拌时间、成型温度等参数优化了柔性传感单元的灵敏度性能。首先在单因素分析的基础上,应用实验设计(DOE)中的中心复合实验方法(CCD)进行多因素实验设计,通过响应面法(RSM)和支持向量机(SVR)对多因素的交互影响进行了分析,并分别建立了灵敏度预测模型。其次根据决定系数(R2)、均方根误差(Rmse)和平均误差率(Mae)对两种模型进行评估与定型,模型性能对比结果表明,通过超参优化后的SVR模型表现出更高水平的准确性和可预测性。然后基于改进的蜣螂优化算法(IDBO)对模型进行迭代优化,得到了比早期实验更好的灵敏度性能。仿真结果显示,在0~30 kPa的单轴压力下,当CNT含量为2.3wt%、MLG含量为1.9wt%、混合时间15 min、成型温度78℃时,灵敏度达到
0.5512 kPa−1,经过实验验证,与实际灵敏度(0.5371 kPa−1)的相对误差为2.625%,且与同类型研究相比较,本文的传感单元灵敏度性能也处较高水平。证明该方法有助于寻找最佳的传感器含量配比与制备工艺,提升实验效率,节约实验成本,为快速制备高性能电容式柔性压力传感单元提供了新思路。Abstract:To enhance the preparation process of flexible pressure sensors and improve their sensitivity characteristics, objective measures must be taken. This study identified the main factors affecting performance through a sensitivity analysis model. The sensitivity performance of the flexible sensing unit was optimized by adjusting the parameters of carbon nanotubes (CNTs), multilayered graphene (MLG), mixing time, and molding temperature using mechanical co-mingling. The study utilized the central combinatorial method (CCD) in design of experiments (DOE) for multi-factor experimental design. The interaction effects of the multi-factors were analyzed using response surface methodology (RSM) and support vector machine (SVR), based on single-factor analysis. Sensitivity prediction models were established accordingly. The two models were evaluated and finalized based on the coefficient of determination (R2), root mean square error (Rmse), and mean error rate (Mae). The results indicate that the SVR model, optimized by hyperparameterization, exhibits a higher level of accuracy and predictability. The model was then iteratively optimized using the improved dung beetle optimization (IDBO) algorithm, which yielded better sensitivity performance than earlier experiments. The simulation results show a sensitivity of
0.5512 kPa−1 at a uniaxial pressure of 0-30 kPa when the CNTs content is 2.3wt%, the MLG content is 1.9wt%, the mixing time is 15 min, and the molding temperature is 78℃. The experimentally verified relative error to the actual sensitivity (0.5371 kPa−1) is 2.625% and the sensitivity performance of the sensing unit in this study is also at a high level when compared with similar studies. It is proved that this method helps to find the optimal sensor content ratio and preparation process, improve the experimental efficiency, save the experimental cost, and provide a new idea for the rapid preparation of high-performance capacitive flexible pressure sensing units. -
超高性能混凝土(UHPC)是一种具有高强度、高韧性、高耐久性的水泥基复合材料,与钢筋具有超高的黏结强度[1-2]。UHPC在重载、大跨、抗震、抗爆和抗冲击等结构中具有广阔的应用前景。与钢筋/普通混凝土结构相同,配筋/UHPC结构中存在钢筋连接接长问题,最简便的钢筋连接接长方式是搭接连接,钢筋/UHPC的高黏结强度可以使钢筋的搭接长度大幅缩短,使UHPC得以用于预制装配式桥梁结构[3-4]和建筑结构[5]中预制构件的连接,仅需较小的搭接长度且钢筋无需弯钩锚固,减少了施工的复杂程度和现场湿作业量。另外,Dagenais等[6]还应用UHPC的高黏结性能加固搭接长度不足的钢筋/混凝土结构,取得了良好效果。
采用直接拔出锚固试验是较为常用的研究钢筋/UHPC黏结性能的试验方法。Graybeal[7]将直径为12.7 mm、15.9 mm、19.1 mm的钢筋分别锚固75 mm、100 mm、125 mm于UHPC圆柱体中,均发生钢筋拉断破坏而未出现黏结破坏。Swenty等[8]采用直径为12.7 mm的钢筋锚固于边长为150 mm的立方体试块中,采用两种不同配合比的UHPC,分别实现了钢筋的屈服和拉断。Holschemacher等[9]采用直径为12 mm的钢筋锚固在UHPC圆柱体中,测得黏结强度高达60 MPa。Jungwirth等[10]对直径为20 mm和12 mm的钢筋进行锚固试验,黏结强度分别达到38 MPa和66 MPa。Alkaysi等[11]通过锚固试验研究了UHPC的早期龄期(1天、3天、7天)的黏结强度,结果表明在7天龄期时,可以达到75%的最终黏结强度。Graybeal[12]的试验结果表明:影响UHPC黏结强度的主要因素有保护层厚度、锚固长度和钢筋直径。Bae等[13]通过锚固试验研究发现:钢纤维体积分数由0增加到1%,钢筋与UHPC的黏结强度提高了1倍,由1%增加到2%,黏结强度提高幅度变小。Saleem等[14]研究了高强钢筋在UHPC中锚固长度,结果表明:直径9.5 mm和22.2 mm高强钢筋的锚固长度分别为12倍和18倍的钢筋直径。安明喆等[15]通过钢筋拔出试验,研究了变形钢筋直径和锚固长度对钢筋/活性粉末混凝土(RPC)黏结性能的影响,提出变形钢筋与RPC的极限黏结强度与锚固长度的计算公式。邓宗才等[16]通过54个中心拉拔、6个立方体偏心拉拔、6个棱柱体中心拉拔和6个板式中心拉拔锚固试件系统研究了钢筋埋长、保护层厚度、钢筋直径、RPC强度和钢纤维体积掺量等因素对钢筋/RPC黏结性能的影响规律。贾方方[17]通过5组直接拔出锚固试件研究了不同纤维体积掺量对钢筋/RPC黏结性能的影响,结果表明:纤维体积掺量从0增大到2%,黏结强度逐渐增大。
采用直接拔出锚固试件对钢筋/UHPC黏结性能的研究较为充分,但加载时锚固试件钢筋受拉,周围UHPC受压,与实际结构构件受力不符,锚固试件加载端容易受到约束,限制UHPC的开裂,测得的黏结强度偏高,且目前尚未建立直接拔出锚固黏结与实际搭接黏结的关系,对实际应用指导有限。采用梁式搭接试件研究的钢筋/UHPC黏结性能与实际构件搭接受力最为相符。Dagenais等[6, 18]将UHPC应用于钢筋搭接长度不足的钢筋/混凝土受弯构件的加固中,分别进行了单调和滞回试验研究,研究结果表明钢筋/UHPC的搭接黏结强度约为普通混凝土的两倍,采用UHPC加固过的构件可以适用于地震区。Al-Quraishi等[19]试验了6根梁式钢筋搭接试件,研究了钢筋在UHPC中搭接性能,结果表明UHPC的劈裂是钢筋搭接失效的主要破坏模式。由于梁式搭接试件制作和加载过程较为复杂,研究数量有限。
钢筋搭接对拉拔出试验能较好地反应实际构件的搭接受力,且能简化试验。徐有邻等[20]通过普通混凝土中钢筋搭接对拉拔出试验和梁中搭接钢筋传力对比试验,观察了搭接钢筋的传力机制、受力特征和破坏形态,发现对拉试验与梁中钢筋搭接试验结果基本相符。Graybeal[21]将强度为1 860 MPa的钢绞线在掺加不同纤维的UHPC中搭接,进行了对拉拔出试验,钢筋在掺加钢纤维的UHPC (抗压强度为162 MPa)中所需的搭接长度小于掺加PVA纤维的UHPC (抗压强度为134 MPa)。Lagier等[22]通过钢筋搭接对拉拔出试验研究了纤维体积掺量和搭接长度对搭接性能的影响,通过钢筋内部开槽粘贴应变片研究了钢筋沿搭接长度的应变分布。方志等[23]试验了39个钢筋/RPC搭接对拉拔出试件,发生破坏时,搭接区域的搭接黏结强度随搭接长度增大而略有减小,随RPC强度和配箍率的增大而增大,并研究了钢筋净距对搭接黏结强度的影响,在1倍钢筋直径时黏结强度达到最大。
目前,针对钢筋/UHPC锚固试验的研究较充分,钢筋搭接试验的研究有限,且未建立钢筋/UHPC锚固和搭接之间的关系及指导实际设计的算法。本文进行了21组考虑搭接长度、纤维体积掺量和配箍率影响的钢筋/UHPC搭接对拉拔出试验,3组考虑锚固长度影响的钢筋/UHPC直接拔出锚固试验。研究钢筋锚固和搭接连接试件的破坏形态,分析钢筋搭接黏结强度的影响因素,参考相关文献,拟合得到钢筋/UHPC锚固和搭接试件的平均黏结强度计算公式及锚固和搭接长度计算公式,建立钢筋/UHPC锚固和搭接长度简化算法。
1. 试验概况
1.1 试件设计
设计了21组钢筋/UHPC搭接连接试件,每组3个试件完全相同,试件的主要变化参数有搭接长度、纤维体积掺量和配箍率。采用的钢筋直径为25 mm,搭接长度范围在3d~12d (d为钢筋直径)不等,以期发生多种破坏形态。纤维体积分数取值为2%、3%和4%。箍筋作为一种加强措施,其体积配箍率为0.67%、1.35%和2.25%。试件的截面尺寸为150 mm×150 mm,钢筋净距为10 mm;另外,设计了3组钢筋锚固试件作为对比试件,试件的截面尺寸为115 mm×115 mm,以保证与钢筋搭接连接试件的保护层厚度一致,均为45 mm;为了减轻试件端部对黏结段的影响,采用塑料套管将端部钢筋与UHPC隔离,长度为50 mm,因此,试件的长度为L+2×50 mm (L为搭接长度),试件尺寸如图1所示。试件参数及主要试验结果如表1所示。
![]() 图 1 钢筋/超高性能混凝土(UHPC)搭接试件尺寸及制作(单位:mm)Figure 1. Size and fabrication of steel bars/ultra high performance concrete (UHPC) lap-splice specimens (Unit: mm)
图 1 钢筋/超高性能混凝土(UHPC)搭接试件尺寸及制作(单位:mm)Figure 1. Size and fabrication of steel bars/ultra high performance concrete (UHPC) lap-splice specimens (Unit: mm)试件编号中A和LS分别代表钢筋锚固试件和钢筋搭接连接试件,第2、3、4个符号的数字分别代表纤维体积分数(%)、配箍率(%)和搭接长度。例如:LS-2-0-3d表示钢筋搭接连接试件,纤维体积掺量为2%,配箍率为0,搭接长度为3倍的钢筋直径。
表 1 钢筋锚固和搭接钢筋/UHPC试件参数及试验结果Table 1. Parameters and test results of anchorage and lap-splice steel bars/UHPC specimensNumber Notation Vf/% ρsv/% L fcu/MPa fc/MPa Py/kN Ps/kN Pu/kN τmt/MPa Failure mode 1 A-2-0-3d 2 0 3d 117.1 103.6 — 190.4 197.6 33.6 SPF 2 A-2-0-5d 5d 218.6 265.2 269.5 27.5 SPF 3 A-2-0-7d 7d 220.4 284.6 298.1 21.7 SPF 4 LS-2-0-3d 2 0 3d 117.1 103.6 — 111.9 130.2 22.1 SPF 5 LS-2-0-5d 5d — 143.4 171.8 17.5 SPF 6 LS-2-0-7d 7d — 173.3 208.3 15.1 SPF 7 LS-2-0-8d 2 0 8d 110.1 100.9 219.1 223.4 234.2 14.9 SPF 8 LS-2-0-10d 10d 215.6 246.9 266.0 13.6 SPF 9 LS-2-0-12d 12d 217.6 272.8 293.7 12.5 SPF 10 LS-3-0-8d 3 0 8d 116.6 105.5 217.2 245.8 253.2 16.1 SPF 11 LS-3-0-10d 10d 219.1 265.7 284.8 14.5 SPF 12 LS-3-0-12d 12d 216.3 285.9 298.8 12.7 RF 13 LS-4-0-6d 4 0 6d 112 102 217.1 201.3 224.0 19.0 SPF 14 LS-4-0-8d 8d 215.3 244.9 250.1 16.0 SPF 15 LS-4-0-10d 10d 217.1 276.3 282.2 14.4 SPF 16 LS-2-0.67-6d 2 0.67 6d 110.1 100.9 218.2 164.9 236.6 20.1 SPF 17 LS-2-0.67-8d 8d 218.4 180.5 243.5 15.5 SPF 18 LS-2-0.67-10d 10d 215.8 201.3 292.9 14.94 SPF 19 LS-2-1.35-4d 2 1.35 4d 110.1 100.9 — 122.6 195.3 24.9 SPF 20 LS-2-1.35-6d 6d 218.8 146.6 244.3 20.7 SPF 21 LS-2-1.35-8d 8d 219.4 202.4 304.2 19.4 RF 22 LS-2-2.25-4d 2 2.25 4d 110.1 100.9 — 128.1 206.0 26.2 SPF 23 LS-2-2.25-6d 6d 219.4 167.7 257.9 21.9 SPF 24 LS-2-2.25-8d 8d 214.5 216.0 302.8 19.3 RF Notes: d—Steel bar diameter; Vf—Fibre volume fraction; ρsv—Hoop ratio; L—Embedment length; fcu—Compressive strength of cube; fc—Compressive strength of prism; Py, Ps and Pu—Yield, slippage and peak loads in the test, respectively; τmt—Mean bond strength measured in the test; SPF and RF represent the splitting pull-out failure and steel bar rupture failure, respectively. The “A” and “LS” in notation system—Anchorage specimen and lap-splice specimen, respectively. The figures in the second, third and fourth symbol—Fibre volume fraction (%), stirrup ratio (%) and embedment length, respectively. For example, the notation of “LS-2-0-3d”—Splice specimen with 2% of fibre volume fraction, 0% of stirrup ratio and 3 bar diameters embedment. 1.2 试验材料
1.2.1 UHPC
试验采用的UHPC配合比如表2所示,其中水泥选用P·O42.5级普通硅酸盐水泥;粉煤灰为Ⅰ级粉煤灰;细骨料采用石英砂,粒径范围为0.16~1.25 mm;硅灰选择无定型超细(非晶体)粉末,灰白色球状粉末,比表面积143 100 cm2/g;减水剂为聚羧酸系高效减水剂,减水率为30%,含固量32%;钢纤维选用上海某公司生产的带钩镀铜钢纤维,长度13 mm,直径0.22 mm,抗拉强度大于2 850 MPa。试件采用常温养护,试件成型后24 h拆模,浇水养护14天。
表 2 UHPC配合比Table 2. Mix proportions of UHPCNumber Water to
binder ratioCement Fly
ashSilica
fumeMineral
powderQuartz
sandSuperplasticizer Volume fraction of
steel fiber Vf1 0.18 1.00 0.30 0.30 0.30 1.3 0.05 0.02 2 0.18 1.00 0.30 0.30 0.30 1.3 0.05 0.03 3 0.18 1.00 0.30 0.30 0.30 1.3 0.05 0.04 每种UHPC配合比制作3个边长为100 mm的立方体试块和3个尺寸为100 mm×100 mm×300 mm的棱柱体试块分别测UHPC的立方体抗压强度(fcu)和棱柱体抗压强度(fc)。
1.2.2 钢筋
锚固和搭接钢筋的强度等级均为HRB400,直径为25 mm,箍筋和架立筋的强度等级为HPB300,直径为8 mm。钢筋力学性能如表3所示。
表 3 钢筋力学性能Table 3. Mechanical properties of steel barsDiameter/mm Strength grade Yield strength/MPa Ultimate strength/MPa 25 HRB400 447 611 18 HRB400 436 608 8 HPB300 364 540 1.3 试验装置及测试内容
钢筋直接拔出锚固试验加载装置如图2(a)所示,钢筋锚固试验在100 t万能试验机上进行,采用位移控制加载,速率为0.5 mm/min。钢筋自由端安装位移计来测量自由端滑移量,通过TDS-530数据采集设备进行力和位移的采集。
钢筋搭接连接试验加载装置如2(b)所示,采用50 t锚杆拉拔仪通过手动加载对钢筋施加拉拔力,通过压力数显表人工读取拉力的大小;通过百分表来测量钢筋自由端与试块的相对滑移量;采用KD7016程控静态应变仪人工读取箍筋的应变。由于钢筋搭接连接试件两根钢筋不同轴,拉拔时会产生弯矩造成试件的转动,试块两侧放置限位钢垫块平衡弯矩。
2. 试验结果与分析
试件加载过程中的最大荷载称为极限荷载Pu,钢筋自由端出现滑移时的荷载称为滑移荷载Ps,屈服荷载Py实际是钢筋发生屈服时的荷载,各荷载值如表1所示。图3为各类型试件的极限荷载随锚固或搭接长度的变化关系,可以发现大部分试件的钢筋均发生屈服,一些试件的极限荷载接近甚至达到钢筋的极限受拉承载力。总体上,试件的极限荷载与钢筋锚固或搭接长度近似呈线性关系。
![]() 图 3 钢筋/UHPC锚固或搭接试件极限荷载-埋长曲线Figure 3. Ultimate load versus embedment length curves of anchorage and pull out lap-splice specimens of steel bars in UHPC
图 3 钢筋/UHPC锚固或搭接试件极限荷载-埋长曲线Figure 3. Ultimate load versus embedment length curves of anchorage and pull out lap-splice specimens of steel bars in UHPC2.1 钢筋/UHPC锚固或搭接试件破坏模式
图4为钢筋/UHPC 锚固或搭接试件破坏形态。如图所示,本次试验共出现2种破坏模式,分别是劈裂拔出破坏和钢筋拉断破坏,破坏模式主要受搭接长度的影响,搭接长度越大,试件提供的抗拉拔合力越大,越容易发生钢筋拉断破坏。此外,纤维体积掺量和配箍率也对破坏模式有一定的影响。
![]() 图 4 钢筋/UHPC锚固或搭接试件破坏形态Figure 4. Failure patterns of anchorage and lap-splice specimens of steel bars in UHPC
图 4 钢筋/UHPC锚固或搭接试件破坏形态Figure 4. Failure patterns of anchorage and lap-splice specimens of steel bars in UHPC2.1.1 劈裂拔出破坏
所有的锚固试件和除LS-3-0-12d、LS-2-1.35-8d和LS-2-2.25-8d以外的搭接试件均发生劈裂拔出破坏。
对于发生劈裂拔出破坏未配箍筋的试件,加载初期荷载较小,试件无明显现象;加载至约0.25Pu时试件出现端面放射状裂缝,荷载由钢筋加载端向自由端传递,钢筋与UHPC锚固试件加载端的界面已开始局部滑移,自由端附近界面处于黏结状态;约0.36Pu时,因斜向压肢的推力造成两筋间的分离趋势,引起环向应力,试件出现侧面纵向劈裂裂缝,此时裂缝长度和宽度均较小;随着荷载的增加,裂缝不断延伸且加宽,同时又有新的端面放射状裂缝和侧面纵向裂缝产生,当钢筋自由端出现微小滑移时,各试件滑移荷载在0.83Pu~0.98Pu范围内,此时,加载端到自由端的化学黏结力逐步被削弱、丧失,拉力主要依靠钢筋肋部的机械咬合力与钢筋表面的摩擦力传递,此后荷载增长缓慢,裂缝继续延伸和加宽,钢筋自由端滑移增大;当纵向裂缝即将贯通时,裂缝宽度急剧增大,试件达到极限荷载Pu,发生纵向劈裂拔出破坏。钢筋锚固试件破坏见图4(a),钢筋搭接连接试件破坏见图4(b)。
对于发生劈裂拔出破坏配有箍筋的搭接试件,与未配箍筋的试件相比,其侧面纵向开裂荷载有所提高,约为0.4Pu,滑移荷载在0.60Pu~0.74Pu范围内,钢筋出现滑移后,荷载仍然会有显著的提高;达到Pu时,侧面纵向裂缝宽度增大,但未完全贯通,钢筋自由端滑移加快,钢筋逐渐从UHPC中拔出,如图4(c)所示。箍筋对UHPC的约束作用延迟了纵向裂缝的产生,纵向裂缝出现后,箍筋应变快速增大,产生较大的约束力,限制侧面纵向裂缝的加宽和延伸,达到Pu时侧面纵向裂缝未贯通。
2.1.2 钢筋拉断破坏
试件LS-3-0-12d纤维体积分数为3%,试件LS-2-1.35-8d和LS-2-2.25-8d的体积配箍率分别为1.35%和2.25%,三组试件均发生钢筋拉断破坏。与劈裂拔出破坏相比,加载初期试件端部也出现放射状裂缝,继续加载侧面出现纵向裂缝,但之后试件裂缝发展缓慢甚至停止发展,随着荷载的不断增大,最终发生钢筋拉断破坏,见图4(d),钢筋自由端始终未出现滑移。3%的纤维体积分数、1.35%和2.25%的配箍率可以有效提供侧向约束,使试件只需较短的搭接长度(分别为12d、8d、8d)就发生了钢筋的拉断破坏。
2.2 钢筋/UHPC平均黏结强度影响因素
钢筋/UHPC黏结应力沿锚固或搭接长度分布不均匀,且长度越大黏结应力分布越不均匀。采用钢筋/UHPC平均黏结应力来评估其黏结性能,计算公式如下:
τ=PπdL (1) 式中:P为对拉荷载;d为钢筋直径;L为锚固或搭接长度。对应于发生黏结破坏的应力称为平均黏结强度。
2.2.1 钢筋埋置长度的影响
随着钢筋埋置长度的增大,钢筋拉拔应力由加载端向自由端传递的路径随之增大,可以延迟自由端的钢筋/UHPC黏结破坏,进而增大钢筋的极限荷载,如图3所示。但由于实际黏结应力分布不均匀,靠近加载端的黏结应力大,远离加载端的黏结应力小,增大埋置长度使远离加载端应力较小的部分变长了,因此,平均黏结应力随之减小,如图5所示。
![]() 图 5 钢筋/UHPC平均黏结强度与埋置长度关系Figure 5. Average bond strength versus embedded length of steel bars/UHPC
图 5 钢筋/UHPC平均黏结强度与埋置长度关系Figure 5. Average bond strength versus embedded length of steel bars/UHPC2.2.2 钢纤维掺量的影响
图6展示了钢筋/UHPC 平均黏结强度与钢纤维体积分数关系。如图所示,钢纤维体积分数由2%提高到3%,在8d和10d的搭接长度时,平均黏结强度分别提高了8.0%和6.7%。钢纤维在基体中乱向分布,阻止了硬化过程中微裂纹的产生,在受力过程中,钢纤维会阻挠裂纹的扩展,迫使其改变方向,缓冲裂缝尖端处的应力集中,从而起到阻裂的作用[17]。有效地约束了UHPC,抑制了劈裂裂缝的发展,提高了钢筋与UHPC的黏结强度[24]。钢纤维体积分数由3%提高到4%,在8d和10d的搭接长度时,平均黏结强度出现了略微降低,分别降低了0.80%和0.83%,其原因可能是钢纤维掺量增大,影响了UHPC的和易性和钢纤维的分散性,导致UHPC的密实度降低,降低了钢筋/UHPC黏结性能。
![]() 图 6 钢筋/UHPC平均黏结强度与钢纤维体积分数关系Figure 6. Average bond strength versus fibers fraction of steel bars/UHPC
图 6 钢筋/UHPC平均黏结强度与钢纤维体积分数关系Figure 6. Average bond strength versus fibers fraction of steel bars/UHPC2.2.3 配箍率的影响
试验过程中记录了每一级荷载作用下的箍筋应变,如图7所示,试件加载初期箍筋应变值较小,呈线性缓慢增长;随着荷载增加,试件内部出现裂缝,箍筋应变迅速增长,曲线斜率变大,达到极限荷载时,大部分箍筋达到屈服,强度得到充分发挥。
![]() 图 7 钢筋/UHPC搭接试件箍筋应变-荷载曲线Figure 7. Stirrup strains versus loads curves of steel bars lap-splice UHPC specimens
图 7 钢筋/UHPC搭接试件箍筋应变-荷载曲线Figure 7. Stirrup strains versus loads curves of steel bars lap-splice UHPC specimens配箍率对平均黏结强度的影响规律见图8,随着配箍率的增大平均黏结强度随之增大,箍筋可以对UHPC形成有效的约束,使钢筋周围UHPC处于多轴受压应力状态[25],钢筋之间斜向压肢的推力造成两筋间的分离趋势,会引起环向应力,箍筋可以抵消环向分力,有效抑制试件的纵向劈裂,进而提高黏结强度。
![]() 图 8 钢筋/UHPC平均黏结强度与配箍率关系Figure 8. Average bond strength versus stirrup ratio curves of steel bars/UHPC
图 8 钢筋/UHPC平均黏结强度与配箍率关系Figure 8. Average bond strength versus stirrup ratio curves of steel bars/UHPC3. 钢筋/UHPC锚固及搭接黏结强度计算
3.1 钢筋/UHPC锚固黏结强度
参考普通混凝土钢筋搭接强度拟合公式的形式[20],本文搜集了文献[15-17]中的钢筋/UHPC锚固试验数据,如表4所示,并根据本文的试验结果,拟合得到考虑钢筋直径、锚固长度、保护层厚度、纤维体积掺量和抗压强度影响的锚固黏结强度计算公式:
表 4 钢筋/UHPC锚固和对拉拔出搭接试件试验数据Table 4. Test data of anchorage specimens and pull out lap-splice specimens of steel bars in UHPCReference Notation d/mm L/mm c/mm ρsv fcu/MPa Vf τut/MPa Anchorage specimen [15] φ14-50 14 50 68 0 147.78 0.023 37.07 φ15-50 16 50 67 0 147.78 0.023 33.28 φ16-50 18 50 66 0 147.78 0.023 29.87 φ17-50 18 75 66 0 147.78 0.023 28.94 [16] H1-LZ-8-24 8 24 71 0 121.77 0.02 55.3 H1-LZ-8-32 8 32 71 0 121.77 0.02 45.7 H1-LZ-10-30 10 30 70 0 121.77 0.02 46.1 H1-LZ-10-40 10 40 70 0 121.77 0.02 42.9 H2-LZ-16-48 16 48 67 0 132.39 0.02 52.7 H2-LZ-16-64 16 64 67 0 132.39 0.02 42.9 H2-LZ-16-80 16 80 67 0 132.39 0.02 34.1 H2-LZ-18-54 18 54 66 0 132.39 0.02 55 H2-LZ-18-72 18 72 66 0 132.39 0.02 42.3 H3-LZ-6-18 6 18 72 0 153.09 0.03 51.1 H3-LZ-8-24 8 24 71 0 153.09 0.03 70.5 H3-LZ-8-32 8 32 71 0 153.09 0.03 52.8 H3-LZ-10-30 10 30 70 0 153.09 0.03 62.2 H2-NZ-16-12 16 48 12 0 132.39 0.02 31.1 H2-NZ-16-22 16 48 22 0 132.39 0.02 36 H2-NZ-16-32 16 48 32 0 132.39 0.02 41.9 H2-NZ-16-42 16 48 42 0 132.39 0.02 47.7 H2-NZ-16-52 16 48 52 0 132.39 0.02 48.8 H2-NZ-16-62 16 48 62 0 132.39 0.02 52.8 H3-LP-8-10 8 40 10 0 153.09 0.03 29.9 H3-LP-8-15 8 40 15 0 153.09 0.03 29.1 [17] P0.0 16 50 67 0 79.81 0 29.7 P0.5 16 50 67 0 92.27 0.005 31.18 P1.0 16 50 67 0 114.30 0.01 32.05 P1.5 16 50 67 0 117.02 0.015 36.72 P2.0 16 50 67 0 128.58 0.02 38.12 Lap-splice specimen [23] L100-R100-D1-S0 20 100 45 0 96.03 0.02 17.14 L100-R100-D1-S34 20 100 45 0.0034 96.03 0.02 18 L100-R100-D1-S75 20 100 45 0.0075 96.03 0.02 19.03 L100-R120-D1-S0 20 100 45 0 117.36 0.02 18.95 L100-R120-D1-S34 20 100 45 0.0034 117.36 0.02 19.9 L100-R120-D1-S75 20 100 45 0.0075 117.36 0.02 21.04 L100-R150-D1-S0 20 100 45 0 141.39 0.02 20.36 L100-R150-D1-S34 20 100 45 0.0034 141.39 0.02 22.12 L100-R150-D1-S75 20 100 45 0.0075 141.39 0.02 23.35 L150-R100-D1-S34 20 150 45 0.0034 96.03 0.02 17.52 L150-R120-D1-S34 20 150 45 0.0034 96.03 0.02 19.18 L200-R100-D1-S34 20 200 45 0.0034 96.03 0.02 14.75 L200-R100-D1-S34 20 200 45 0.0034 96.03 0.02 13.74 Notes: d—Steel bar diameter; L—Embedment length; c—Thickness of UHPC cover; ρsv—Hoop ratio; fcu—Compressive strength of cube; Vf—Fibre volume fraction; τut—Test value of ultimate average bond strength. τua=(0.53+2.31dlsa)(3.633+0.217cd)(0.604+1.839Vf)√fc (2) 回归公式的相关系数为0.97;适用范围:相对保护层厚度c/d在[1,5],纤维体积掺量Vf在[0,0.03],抗压强度fc在[80,150]。式中:τua为钢筋/UHPC极限锚固黏结强度;d为钢筋直径;lsa为锚固长度;c为保护层厚度,当相对保护层厚度c/d大于5时,取为5;fc为UHPC单轴抗压强度。
3.2 钢筋/UHPC搭接黏结强度
文献[23]通过试验数据拟合回归了钢筋搭接黏结强度公式,但没有考虑UHPC中纤维掺量因素的影响,本试验进一步丰富了搭接试验的数据,对文献[23]的公式进行验证,发现与试验值具有较大误差,如图9所示。因此,结合本文试验结果并参考文献[23]的试验数据(表4),拟合得到考虑钢筋直径、搭接长度、保护层厚度、配箍率、纤维体积掺量和抗压强度影响的钢筋/UHPC搭接黏结强度计算公式:
![]() 图 9 钢筋搭接强度拟合公式计算值与试验值对比Figure 9. Comparison between the calculated value and the test value of the fitting formula of the steel lap-splice strength
图 9 钢筋搭接强度拟合公式计算值与试验值对比Figure 9. Comparison between the calculated value and the test value of the fitting formula of the steel lap-splice strengthτul=(0.36+2.02dlsl)(0.86+0.57cd)(0.83+2√ρsv+11.65Vf)√fc (3) 回归公式的相关系数为0.99,适用范围:相对保护层厚度c/d在[1.8,2.8],配箍率ρsv在[0,0.0225],纤维体积掺量Vf在[0.02,0.04],抗压强度fc在[90,150]。式中:τul为钢筋/UHPC极限搭接黏结强度;lsl为搭接长度;ρsv为试件配箍率。拟合公式计算值与试验值吻合良好,如图9所示。
为了验证拟合公式的有效性,对文献[6]和[18]的梁式搭接试件的黏结强度进行计算并与试验结果进行对比,如表5所示,计算值与试验值比值的平均值为1.15,变异系数为0.29,与梁式试件试验结果吻合较好。
表 5 钢筋/UHPC搭接梁式试件黏结强度拟合公式验证Table 5. Verification of the fitting formula for lap-splice bond strength of beam lap-splice steel bars/UHPC specimensReference Notation d/mm L/mm c/mm fc/MPa Vf τut/MPa τuf/MPa τuf/τut Beam lap-splice specimen [6] 1-12-25-L 25 300 45 130 0.03 10.8 13.40 1.26 2-12-25-L 25 300 45 130 0.03 9.8 13.40 1.39 1-18-25-L 25 450 45 130 0.03 6.8 11.98 1.96 1-12-35-L 35 420 45 130 0.03 9.8 11.32 1.15 1-18-35-L 35 630 45 130 0.03 6.11 10.12 1.81 1-6-25-L 25 150 45 130 0.03 19.6 17.67 0.74 1-6-25-L1 25 150 45 130 0.03 19.6 17.67 0.74 1-12-25-L1 25 300 45 130 0.03 9.8 13.40 1.39 1-6-35-L 35 210 45 130 0.03 16.23 14.92 0.74 1-6-35-L½ 35 210 45 130 0.03 12.32 14.92 0.97 1-12-35-L½ 35 420 45 130 0.03 9.16 11.32 1.24 [18] 25-12-L-1% 25 300 25 125 0.01 9.5 8.00 1.04 25-12-L-2% 25 300 25 124 0.02 10.4 8.94 0.94 25-12-L-3% 25 300 25 114 0.03 10.5 9.51 0.90 25-12-R-3% 25 300 25 114 0.03 10 9.51 0.94 35-18-L-3% 35 630 35 114 0.03 8.2 8.50 1.13 35-18-R-3% 35 630 35 114 0.03 7.2 8.50 1.28 Average value 1.15 Variation coefficient 0.29 Notes: fc—Uniaxial compressive strength; τut—Test value of ultimate average bond strength; τuf—Value of ultimate average bond strength calculated by the Eq. (3). 4. 钢筋/UHPC临界锚固及搭接长度计算
定义钢筋达到屈服强度fy时,钢筋从UHPC中不被拨出所需的最小锚固和搭接长度分别为临界屈服锚固长度lsay和临界屈服搭接长度lsly;钢筋达到极限强度fu时,钢筋从UHPC中不被拨出所需的最小锚固和搭接长度分别为临界极限锚固长度lsau和临界极限搭接长度lslu。由图3可知,各类型试件的极限荷载随锚固或搭接长度的变化趋势近似为线性,因此,各类试件的临界屈服锚固长度lsayt或搭接长度lslyt (合称为临界屈服长度lsyt)以及临界极限锚固长度lsaut或搭接长度lslut (合称为临界极限长度lsut)可按线性规律近似确定,如表6和图10所示。随着纤维体积掺量和配箍率的增大,临界屈服和极限长度逐渐减小。
表 6 钢筋/UHPC锚固和搭接长度试验值与计算值Table 6. Test values and calculated values of development length and splice length of steel bars/UHPCType Minimum anchorage or lap length of steel bar yield Minimum anchorage or lap length of steel bar rupture lsyACI lsyGB lsys lsyf lsyt lsuACI lsuGB lsus lsuf lsut Anchorage specimen 28.6d 11.2d 5.3d 3.7d 3.6d 39.1d 15.3d 7.2d 6.6d 7.1d 2.25vol% hoops 20.9d 17.9d 10.5d 5.8d 4.5d 28.6d 24.4d 14.4d 10.1d 7.6d 1.35vol% hoops 20.9d 17.9d 10.5d 6.4d 4.9d 28.6d 24.4d 14.4d 11.0d 8.1d 0.67vol% hoops 20.9d 17.9d 10.5d 7.1d 4.8d 28.6d 24.4d 14.4d 11.9d 10.6d 4vol% fibers 28.9d 17.6d 10.6d 6.5d 5.8d 39.4d 24.0d 14.5d 11.1d 13.2d 3vol% fibers 28.3d 16.4d 10.4d 7.5d — 38.7d 22.4d 14.3d 12.5d 12.1d 2vol% fibers 29.0d 17.9d 10.5d 9.3d 7.3d 39.7d 24.4d 14.4d 15.0d 12.6d Notes: lsyACI, lsyGB, lsys and lsyf—Minimum anchorage or lap length of steel bar yield calculated by the ACI 318—19[27], GB 50010—2010[26], simplified algorithm and fitting formula, respectively; lsuACI, lsuGB, lsus, and lsuf—Minimum anchorage or lap length of steel bar rupture calculated by the ACI 318—19[27], GB 50010—2010[26], simplified algorithm and fitting formula, respectively; lsyt—Test value of minimum anchorage or lap length of steel bar yield; lsut—Test value of minimum anchorage or lap length of steel bar rupture. ![]() 图 10 不同类型钢筋/UHPC锚固或搭接试件的临界长度计算值与试验值Figure 10. Test and calculation values of critical length for different types of anchorage and pull out lap splice steel bars/UHPC specimens
图 10 不同类型钢筋/UHPC锚固或搭接试件的临界长度计算值与试验值Figure 10. Test and calculation values of critical length for different types of anchorage and pull out lap splice steel bars/UHPC specimens4.1 规范中钢筋/UHPC的锚固和搭接长度的计算
4.1.1 GB 50010—2010规范[26]的锚固和搭接长度计算
《混凝土结构设计规范》GB 50010—2010[26]中规定受拉钢筋的锚固和搭接长度按下式进行计算:
ls=αξaξlfyftd (4) 式中:α为钢筋的外形系数,考虑钢筋的表面类型对黏结强度的影响,对本文钢筋取0.14;ξa为锚固或搭接长度修正系数,主要考虑了钢筋直径大于25 mm,表面涂有环氧树脂,有施工扰动,实配钢筋面积大于计算钢筋面积以及保护层厚度大于3d或5d等情况的影响;ξ1为纵向受拉钢筋搭接长度修正系数,主要考虑了纵向搭接钢筋接头面积百分率,对本文试件取1.6,对于锚固试件取1.0。
4.1.2 ACI 318—19规范[27]搭接长度的算法
美国规范ACI 318—19[27]根据表7将搭接接头分为A、B两类,其中基本的锚固或搭接长度按下式计算:
As,p/As,r Maximum percent of As spliced
within required lap length/%Splice type Lap splice lengths ls ≥2 50 A Greater of: 1.0ld and 304.8 mm 100 B Greater of: 1.3ld and 304.8 mm <2 All cases B Note: As,p/As,r—Ratio of area of reinforcement provided to area of reinforcement required by analysis at splice location. ldd=3fy40√fc(c+Ktrd) (5) Ktr=40Atrsn (6) 式中:为避免发生钢筋拔出破坏:规定
(c+Ktr)/d⩽ 2.5 ;f为钢筋应力;fc混凝土圆柱体抗压强度,由于缺少抗压强度69 MPa以上的试验数据,限定\sqrt {{f_{\rm{c}}}} \leqslant 8.3 ,但Azizinamini等[28]和Hamad等[29]均认为这条限定并不合理;c为保护层厚度;d为钢筋直径;Atr为垂直于劈裂面的横向钢筋面积;s为横向钢筋间距;n为搭接钢筋数量。由公式可以看出美国规范考虑了混凝土抗压强度、保护层厚度、钢筋直径和箍筋对搭接长度的影响。本文搭接接头按B类接头进行计算。分别采用GB 50010—2010规范[26]及ACI 318—19规范[27]对钢筋/UHPC锚固和搭接长度进行计算,如表6和图10所示,对比试验结果可知:两规范计算的临界锚固和搭接长度偏于保守,尤其对于无箍筋的试件,美国ACI 318—19规范[27]的计算结果过于保守。
4.2 钢筋/UHPC临界锚固、搭接长度拟合公式
4.2.1 临界锚固长度拟合公式
结合式(1)和式(2),可以推出钢筋/UHPC的锚固长度计算公式:
\frac{{{l_{{\rm{sa}}}}}}{d} = \frac{f}{{2.22\left(0.86 + 0.57\dfrac{c}{d}\right)(0.83 + 11.56{V_{\rm{f}}})\sqrt {{f_{\rm{c}}}} }} - 5.61 (7) 式中:
{l_{{\rm{sa}}}}/d 称为相对锚固长度。f取钢筋屈服强度fy时,得临界屈服锚固长度lsayf;当f取钢筋极限强度fu时,得到临界极限锚固长度lsauf。4.2.2 临界搭接长度拟合公式
同样结合式(1)和式(3),可以推出钢筋/UHPC搭接长度计算公式:
\begin{split} &\frac{{{l_{{\rm{sl}}}}}}{d} =\\ &\dfrac{f}{{1.44\left(0.86 + 0.57\dfrac{c}{d}\right)(0.83 + 2\sqrt {{\rho _{{\rm{sv}}}}} + 11.65{V_{\rm{f}}})\sqrt {{f_{\rm{c}}}} }} - 5.61 \end{split} (8) 式中:f取钢筋屈服强度fy时,得临界屈服搭接长度lslyf;f取钢筋极限强度fu时,得到临界极限搭接长度lsauf。
临界锚固和搭接长度拟合公式计算值如表6和图10所示,可知拟合公式计算值与试验值吻合良好。
4.3 钢筋/UHPC临界搭接长度简化算法
为便于工程实际应用,参考GB 50010—2010规范[26]的算法,提出钢筋/UHPC临界锚固和搭接长度简化计算方法。钢筋搭接因仅有部分周径参与力的传递,因此,钢筋的搭接长度较锚固长度长[30]。GB 50010—2010规范[26]以锚固长度为基准,对于纵向搭接钢筋接头面积百分率为25%、50%和100%的情况,搭接长度分别取1.2、1.4和1.6倍的锚固长度。
4.3.1 钢筋/UHPC临界锚固长度简化计算公式
式(4)实际上是根据受力平衡条件建立的锚固长度计算公式
{l_{\rm{s}}} = \dfrac{{{f_{\rm{y}}}d}}{{4{\tau _{\rm{u}}}}} 的变形,采用混凝土的单轴抗拉强度ft替代τu来表征混凝土强度对锚固长度的影响,式(4)中的外形系数\alpha = \dfrac{{{f_{\rm{t}}}}}{{4{\tau _{\rm{u}}}}} 。原海燕[31]对比了UHPC与普通C40混凝土的各项力学性能,UHPC单轴抗拉强度为普通C40混凝土的1.5倍,抗压强度和极限黏结强度均约为普通混凝土的3倍。因此,对于UHPC采用其抗压强度替代τu来表征UHPC强度对锚固长度的影响较为合理。此时,定义外形系数{\alpha _{\rm{u}}} = \dfrac{{\sqrt {{f_{\rm{c}}}} }}{{4{\tau _{\rm{u}}}}} ,通过对本文试验及参考文献[15-17]的数据进行分析计算得αu的取值范围在0.04~0.12之间,因此偏安全的取为0.12。得到钢筋/UHPC锚固长度计算公式:{l_{\rm{s}}} = {\alpha _{\rm{u}}}\frac{f}{{\sqrt {{f_{\rm{c}}}} }}d (9) 式中:f取钢筋屈服强度fy时得临界屈服锚固长度lsay,f取钢筋极限强度fu时得临界极限锚固长度lsau;fc为UHPC单轴抗压强度。
4.3.2 临界锚固长度与搭接长度对比分析
钢筋搭接因仅有部分周径参与力的传递,因此,钢筋的搭接长度较锚固长度长。本文采用直径25 mm的钢筋,相同纤维体积分数(2%)、保护层厚度(45 mm)和UHPC抗压强度(103.6 MPa)且未配箍筋的情况下,分别进行了3d、5d和7d埋置长度的锚固和搭接试验,由表6和图10可知钢筋/UHPC临界屈服锚固和搭接长度分别为3.6d和7.3d,临界极限锚固和搭接长度分别为7.1d和12.6d,可得UHPC中变形钢筋的临界搭接长度约为其临界锚固长度的2倍,验证了文献[23]所推得的结论。因此,钢筋/UHPC搭接长度可由式(9)计算出的锚固长度乘以2得到。
简化算法计算结果如表6和图10所示,式(9)未考虑纤维体积掺量和配箍率的影响,计算结果较为保守,但相比于GB 50010—2010规范[26]及ACI 318—19规范[27]的计算值较为准确。
文献[6]中直径25 mm的钢筋在梁跨中搭接于抗压强度130 MPa、纤维体积分数为3%的UHPC中,保护层厚度为30 mm且未配箍筋,在搭接长度为12d时,单调荷载作用下未发生搭接破坏,分别采用拟合公式和简化算法计算的临界极限搭接长度为12.7d和13.6d,与试验结果相比较为吻合且偏于安全。
5. 结 论
通过21组钢筋搭接对拉拔出试验和3组钢筋直接拔出锚固试验,并参考相关文献数据,得出以下结论:
(1)钢筋搭接试验主要出现劈裂拔出破坏和钢筋拉断破坏2种破坏模式,增大搭接长度和配箍率以及适当增大纤维掺量均有利于试件由劈裂拔出破坏变为钢筋拉断破坏;
(2)试验得出各类型试件的临界屈服和极限搭接长度,对直径为25 mm的HRB400带肋钢筋,在抗压强度为110.1 MPa、纤维体积分数为2%的超高性能混凝土(UHPC)中,保护层厚度为45 mm且未配箍筋时,其临界屈服和极限搭接长度分别为7.3d和12.6d (d为钢筋直径),增加配箍率和适当增大纤维掺量均能减小钢筋/UHPC临界搭接长度;
(3)随搭接长度的增大,钢筋/UHPC平均黏结强度减小;钢纤维掺量的增大及配箍率的增大,提高了箍筋对UHPC的约束作用,有效限制了试件的纵向劈裂,黏结强度随之增大;
(4)采用中国GB 50010—2010规范[26]和ACI 318—19规范[27]计算的钢筋/UHPC锚固和搭接长度与试验结果相比均过于保守。参考相关文献的试验数据,并结合本文的试验结果,拟合得到钢筋锚固试件、钢筋搭接试件的平均黏结强度计算公式及临界锚固和搭接长度计算公式,且采用梁式搭接试验的结果对钢筋/UHPC黏结强度拟合公式进行验证,结果较为吻合。参考中国规范的算法建立了钢筋/UHPC临界锚固和搭接长度简化算法,未考虑纤维掺量和配箍率的影响,计算结果较为保守,相比于GB 50010—2010规范[26]及ACI 318—19规范[27]的计算值较为准确。
-
![]()
图 1 触觉敏感单元制备流程图
CNT—Carbon nanotubes; MLG—Graphene; KH550—Coupling agent
Figure 1. Flow chart for preparation of pressure sensor
![]()
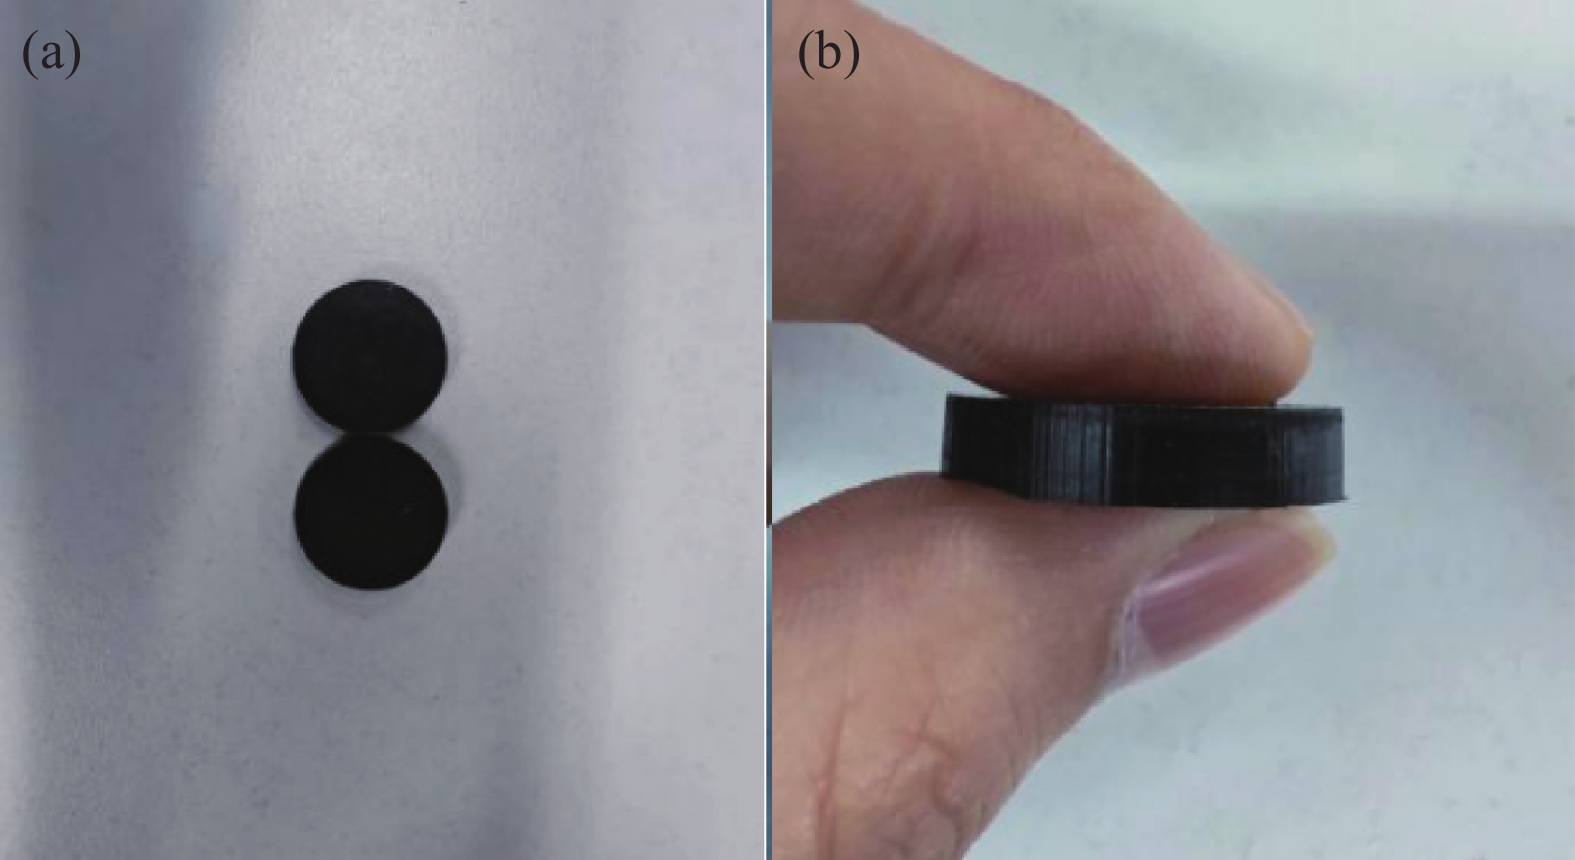
图 3 触觉敏感单元改性前(a)和改性后(b)对比
Figure 3. Comparison between before (a) and after (b) modification of the tactile sensitivity unit
![]()
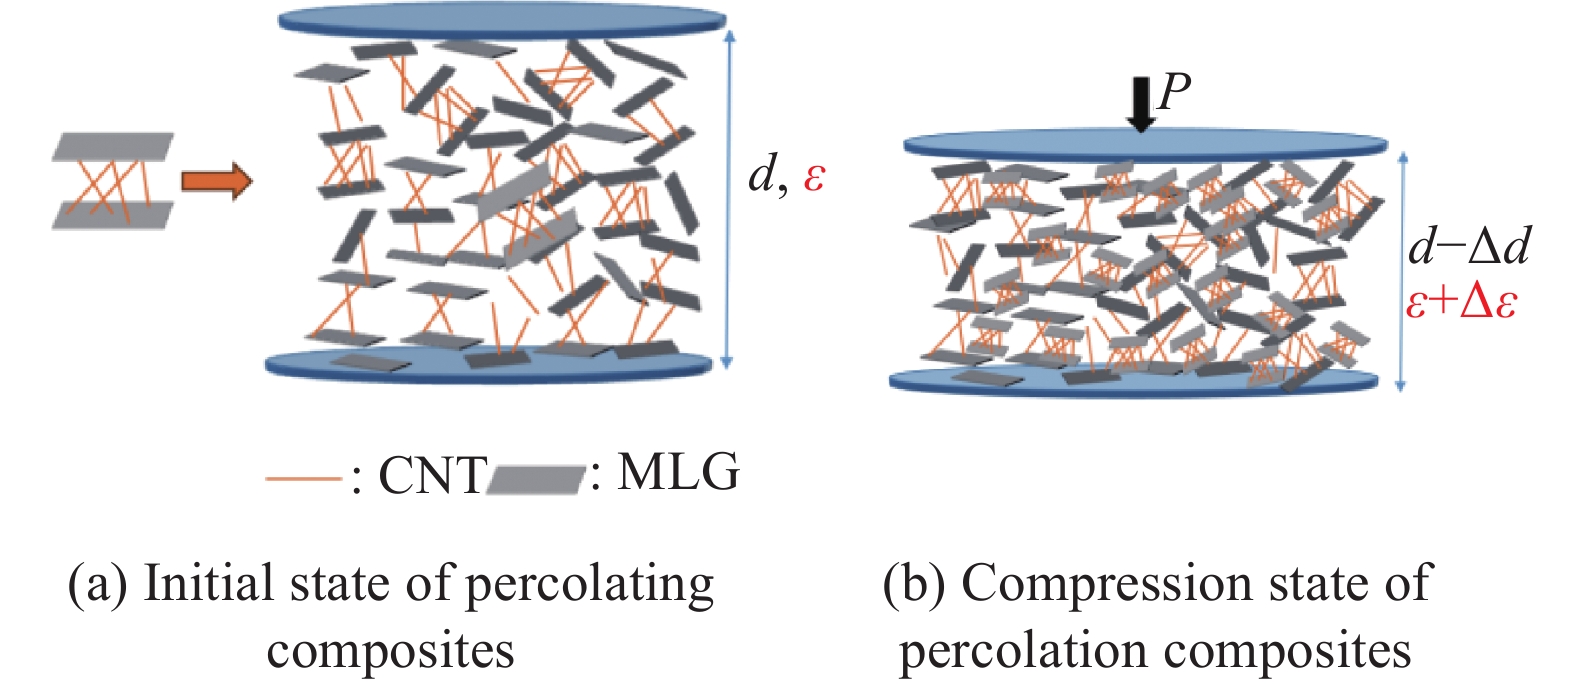
图 5 渗滤复合材料作为介电层的柔性电容式压力传感器的工作原理图
d—Initial thickness; ε—Initial dielectric constant; P—Applied pressure; d–Δd—Material thickness after compression; ε+Δε—Dielectric constant of the composite pressure-sensitive material after compression
Figure 5. Working principle diagram of flexible capacitive pressure sensor with percolation composite as dielectric layer
![]()
图 6 输入参数的单因素影响:(a) CNT含量;(b) MLG含量;(c) 搅拌时间;(d) 成型温度
Figure 6. Single factor effect of input parameter: (a) CNT content; (b) MLG content; (c) Mixing time; (d) Molding temperature
![]()
图 7 支持向量机回归(SVR)模型示意图
Figure 7. Support vector machine regression (SVR) model diagram
xn represents the independent variable; wij represents the weight coefficient; (βi, βi*) represents the Lagrange multiplier used for dual space transformation; K(x, xi) represents the kernel function used to solve the quadratic equation; b represents the deviation; y represents the dependent variable
![]()
图 9 蜣螂优化算法(DBO)流程图
Figure 9. Dung beetle optimization (DBO) algorithm flowchart
t—Number of iterations at the present stage; T—Number of iterations set by the algorithm
![]()
图 10 改进蜣螂优化算法(IDBO)流程图
P— Disturbance probability
Figure 10. Improved dung beetle optimization (IDBO) algorithm flowchart
![]()
图 11 算法性能对比收敛曲线图
GA—Genetic algorithm; PSO—Particle swarm optimization; GWO—Grey wolf optimizer
Figure 11. Algorithm performance comparison convergence plot
![]()
图 12 灵敏度三维响应面图:(a) CNT/MLG相互作用;(b) CNT/搅拌时间相互作用;(c) CNT/成型温度相互作用;(d) MLG/搅拌时间相互作用;(e) MLG/成型温度相互作用;(f)搅拌/成型温度相互作用
Figure 12. Three-dimensional response surface plots of sensitivity: (a) Interaction between CNT/MLG content; (b) Interaction between CNT/mixing time; (c) Interaction between CNT/molding temperature; (d) Interaction between MLG/mixing time; (e) Interaction between MLG/molding temperature; (f) Interaction between mixing time/molding temperature
![]()
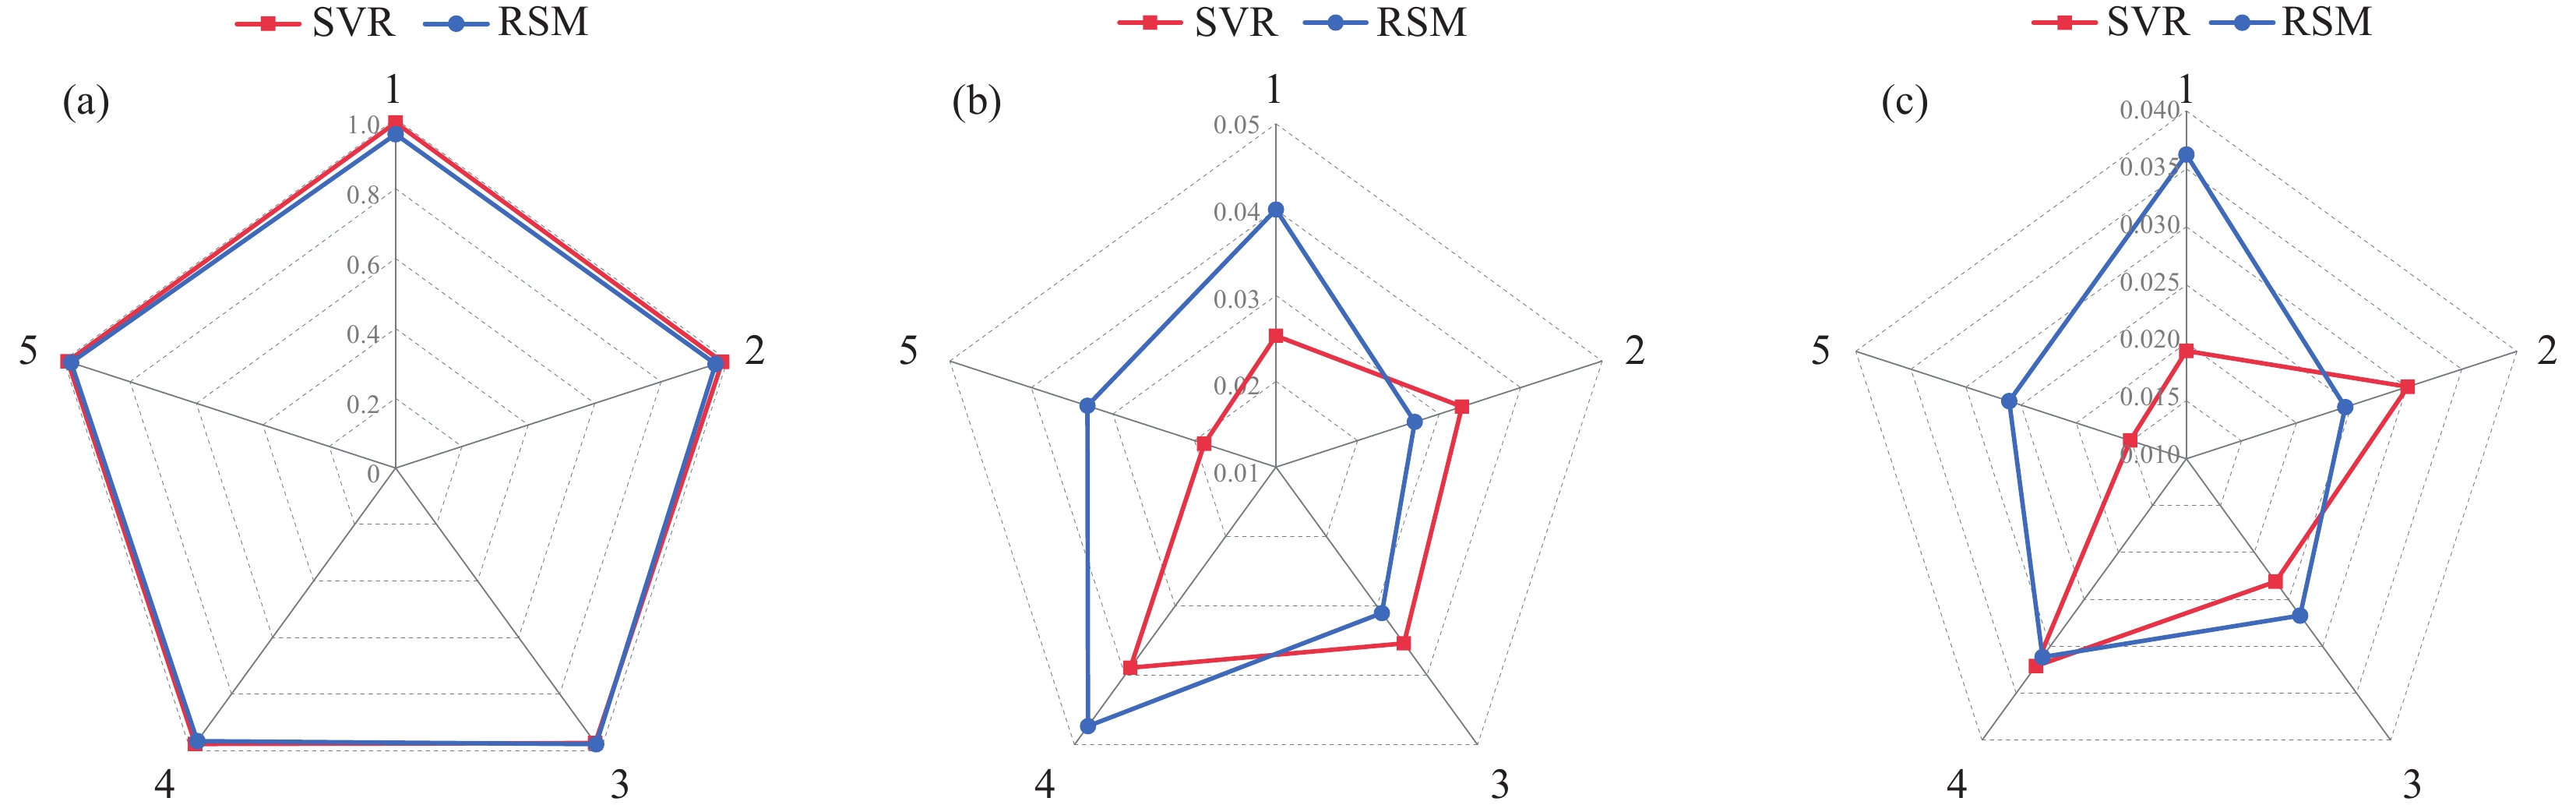
图 14 SVR和RSM模型的5折交叉验证的雷达图
Figure 14. Radar diagrams of SVR and RSM models with 5 fold cross validation
![]()
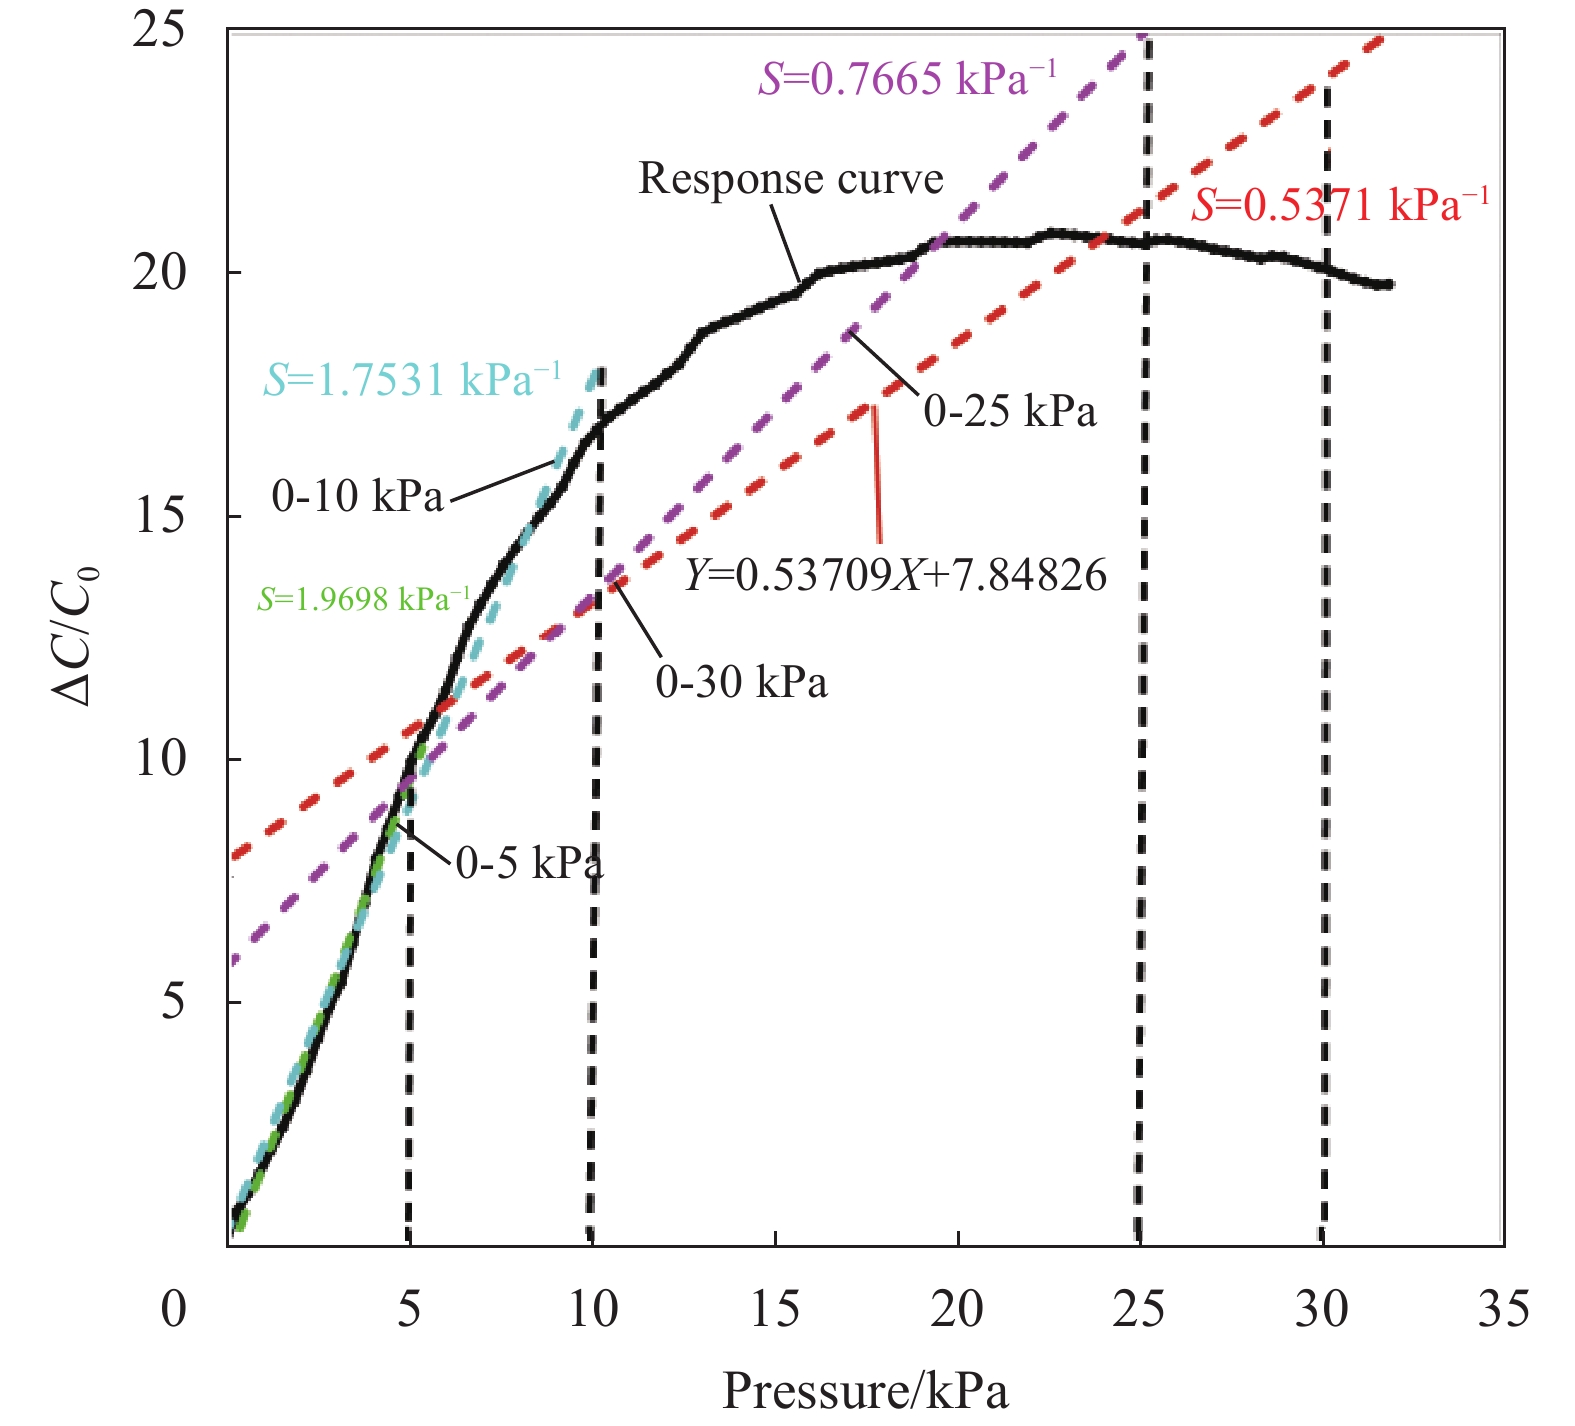
图 16 灵敏度测试电容输出响应曲线
S—Sensitivity; ΔC/C0—Relative change of the capacitance
Figure 16. Sensitivity test capacitor output response curves
表 1 单因素实验方案
Table 1 Single-factor protocol
Index Content of CNT/g Content of MLG/g Mixing time/min Molding temperature/℃ 1 0.4, 0.5, 0.6, 0.7, 0.8, 0.9,
1.0, 1.10.6 15 80 2 0.7 0.4, 0.5, 0.6, 0.7, 0.8, 0.9,
1.0, 1.115 80 3 0.7 0.6 10, 15, 20, 25, 30 80 4 0.7 0.6 15 40, 60, 80, 100, 120  下载: 导出CSV
表 2 4个因素的水平和编码
Table 2 Level and code of four factors
Code Levels factor CNT/g MLG/g Mixing
time/minMolding
temperature/℃−2 0.7 0.6 10 40 −1 0.8 0.7 15 60 0 0.9 0.8 20 80 1 1.0 0.9 25 100 2 1.1 1.0 30 120
下载: 导出CSV
表 3 多因素中心组合实验设计(CCD)与结果
Table 3 Multifactorial central combinatorial experimental design (CCD) and results
Run Factor Sensitivity/
(kPa−1)CNT MLG Mixing
timeMolding
temperature1 1 −1 −1 1 0.227 2 0 0 2 0 0.130 3* 0 0 0 0 0.118 4 −1 −1 −1 1 0.058 5 1 1 1 1 0.191 6 1 −1 −1 −1 0.208 7 −1 1 1 1 0.025 8* 0 0 0 0 0.145 9 −1 1 −1 1 0.050 10 −1 −1 1 −1 0.125 11 −2 0 0 0 0.050 12 0 −2 0 0 0.185 13 0 0 −2 0 0.193 14 −1 1 1 −1 0.164 15 1 1 −1 −1 0.375 16 1 −1 1 −1 0.180 17* 0 0 0 0 0.135 18 1 1 1 −1 0.310 19 0 1 0 0 0.198 20 2 0 0 0 0.478 21 −1 1 −1 −1 0.178 22 0 0 0 0 0.154 23 1 1 −1 1 0.326 24 0 0 0 −2 0.124 25* 0 0 0 0 0.117 26* 0 0 0 0 0.112 27 −1 −1 −1 −1 0.078 28 1 −1 1 1 0.248 29 −1 −1 1 1 0.090 30 0 0 0 2 0.073 Note: * indicates the central repeated trials.
下载: 导出CSV
表 4 灵敏度响应的方差分析
Table 4 Analysis of variance for sensitivity response
Source Sum of squares df Mean square F-value P-value Status Model 0.2877 14 0.0205 32.91 < 0.0001 Significant {x}_{1} -CNT 0.1931 1 0.1931 309.36 < 0.0001 {x}_{2} -MLG 0.0117 1 0.0117 18.789 0.0006 {x}_{3} -Mixing time 0.0036 1 0.0036 5.73 0.0302 {x}_{4} -Temperature 0.0106 1 0.0106 17.02 0.0009 {x}_{1}{x}_{2} 0.0047 1 0.0047 7.46 0.0155 {x}_{1}{x}_{3} 0.0038 1 0.0038 6.11 0.0259 {x}_{1}{x}_{4} 0.0036 1 0.0036 5.81 0.0292 {x}_{2}{x}_{3} 0.0060 1 0.0060 9.68 0.0071 {x}_{2}{x}_{4} 0.0136 1 0.0136 21.83 0.0003 {x}_{3}{x}_{4} 0.0001 1 0.0001 0.2211 0.6449 {{x}_{1}}^{2} 0.0267 1 0.0267 42.79 < 0.0001 {{x}_{2}}^{2} 0.0085 1 0.0085 13.65 0.0022 {{x}_{3}}^{2} 0.0008 1 0.0008 1.26 0.2795 {{x}_{4}}^{2} 0.0030 1 0.0030 4.88 0.0432 Residual 0.0094 15 0.0006 Lack of fit 0.0079 10 0.0008 2.70 0.1422 Not significant Pure error 0.0015 5 0.0003 Cor total 0.2970 29 {R}^{2} 0.9685 {R}_{\mathrm{A}\mathrm{d}\mathrm{j}}^{2} 0.9390 {R}_{\mathrm{P}\mathrm{r}\mathrm{e}\mathrm{d}}^{2} 0.8311 CV/% 14.86 Adequate precision 23.8126 Notes: Cor total—Total number of correlation coefficients; {R}_{\mathrm{A}\mathrm{d}\mathrm{j}}^{2} —Adjusted coefficient of determination; {R}_{\mathrm{P}\mathrm{r}\mathrm{e}\mathrm{d}}^{2} —Predicted coefficient of determination; Adequate precision is an important statistical metric for evaluating the predictive ability of response surface models; CV—Coefficient of variance; df—Number of independent variables.
下载: 导出CSV
表 5 SVR模型的5折交叉验证预测性能评价指标
Table 5 Performance evaluation index of SVR model by 5-fold cross-validation
Index {R}^{2} Rmse Mae 1 0.9893 0.0253 0.0193 2 0.9841 0.0328 0.0301 3 0.9735 0.0354 0.0231 4 0.9769 0.0389 0.0321 5 0.9882 0.0188 0.0151 Average 0.9824 0.0320 0.0239 Notes: Rmse—Root mean square error; Mae—Mean error rate.
下载: 导出CSV
表 6 响应面法(RSM)模型的5折交叉验证预测性能评价指标
Table 6 Performance evaluation index of response surface methodology (RSM) model by 5-fold cross-validation
Index R2 Rmse Mae 1 0.9563 0.04002 0.03623 2 0.9642 0.02701 0.02443 3 0.9778 0.03103 0.02671 4 0.9669 0.04731 0.03113 5 0.9782 0.03312 0.02608 Average 0.96868 0.035698 0.028916
下载: 导出CSV
表 7 传感单元灵敏度性能对比
Table 7 Comparison of sensitivity performance of sensing units
Method Sensitivity/ \mathrm{kP}\mathrm{a}^{-1} Pressure range/ \mathrm{k}\mathrm{P}\mathrm{a} Comparison/ \mathrm{kP}\mathrm{a}^{-1} Ref. Microstructure design 0.451 0-25 0.7665 [12] Microstructure design 0.69 0-10 1.7531 [42] Microstructure design 1.01 0-25 0.7665 [43] Mechanical blending 0.3850 0-30 0.5371 [44] Microstructure design 0.341 0-5 1.9698 [45] Mechanical blending 0.5371 0-30 – This study
下载: 导出CSV
-
[1] GILIOPOULOS D, ZAMBOULIS A, GIANNAKOUDAKIS D, et al. Polymer/metal organic framework (MOF) nanocomposites for biomedical applications[J]. Molecules, 2020, 25(1): 185. DOI: 10.3390/molecules25010185
[2] SHAH V, BHALIYA J, PATEL G M, et al. Advances in polymeric nanocomposites for automotive applications: A review[J]. Polymers for Advanced Technologies, 2022, 33(10): 3023-3048. DOI: 10.1002/pat.5771
[3] CHEN S, YANG K, LENG X, et al. Perspectives in the design and application of composites based on graphene derivatives and bio-based polymers[J]. Polymer International, 2020, 69(12): 1173-1186. DOI: 10.1002/pi.6080
[4] LIU J, HUI D, LAU D. Two-dimensional nanomaterial-based polymer composites: Fundamentals and applications[J]. Nanotechnology Reviews, 2022, 11(1): 770-792. DOI: 10.1515/ntrev-2022-0041
[5] ZHU Y, LIU B, WANG S, et al. Development of a FBG stress sensor for geostress measurement using RSR method in deep soft fractured rock mass[J]. Applied Sciences, 2022, 12(4): 1781. DOI: 10.3390/app12041781
[6] ASYRAF M R M, ISHAK M R, SYAMSIR A, et al. Mechanical properties of oil palm fibre-reinforced polymer composites: A review[J]. Journal of Materials Research and Technology, 2022, 17: 33-65. DOI: 10.1016/j.jmrt.2021.12.122
[7] DU H, FANG C, ZHANG J, et al. Segregated carbon nanotube networks in CNT-polymer nanocomposites for higher electrical conductivity and dielectric permittivity, and lower percolation threshold[J]. International Journal of Engineering Science, 2022, 173: 103650. DOI: 10.1016/j.ijengsci.2022.103650
[8] ZHANG F, FENG Y, QIN M, et al. Stress controllability in thermal and electrical conductivity of 3D elastic graphene-crosslinked carbon nanotube sponge/polyimide nanocomposite[J]. Advanced Functional Materials, 2019, 29(25): 1901383. DOI: 10.1002/adfm.201901383
[9] MOUSSA M, EL-KADY M F, ABDEL-AZEM S, et al. Compact, flexible conducting polymer/graphene nanocomposites for supercapacitors of high volumetric energy density[J]. Composites Science and Technology, 2018, 160: 50-59. DOI: 10.1016/j.compscitech.2018.02.033
[10] LI X, XU W, XIN Y, et al. Supramolecular polymer nanocomposites for biomedical applications[J]. Polymers, 2021, 13(4): 513. DOI: 10.3390/polym13040513
[11] 赵梁成, 李斌, 武思蕊, 等. 功能三维石墨烯-多壁碳纳米管/热塑性聚氨酯复合材料的制备及性能[J]. 复合材料学报, 2020, 37(2): 242-251. ZHAO Liangcheng, LI Bin, WU Sirui, et al. Preparation and properties of functional three-dimensional graphene-multi-walled carbon nanotubes/thermoplastic polyurethane composites[J]. Acta Materiae Compositae Sinica, 2020, 37(2): 242-251(in Chinese).
[12] 药芳萍, 黎相孟, 石强盛杰, 等. 石墨烯-聚合物柔性电容传感器制备及性能研究[J]. 中国机械工程, 2021, 32(24): 2909-2914. DOI: 10.3969/j.issn.1004-132X.2021.24.002 YAO Fangping, LI Xiangmeng, SHI Qiangshengjie, et al. Preparation and performance of graphene-polymer flexible capacitive sensors[J]. China Mechanical Engineering, 2021, 32(24): 2909-2914(in Chinese). DOI: 10.3969/j.issn.1004-132X.2021.24.002
[13] XU B, YE F, CHEN R, et al. A wide sensing range and high sensitivity flexible strain sensor based on carbon nanotubes and MXene[J]. Ceramics International, 2022, 48(7): 10220-10226. DOI: 10.1016/j.ceramint.2021.12.235
[14] 吴其皓, 廖鹏飞, 茅寅, 等. 高灵敏度电容式柔性压力传感器的设计与优化[J]. 传感器与微系统, 2023, 42(4): 107-110. WU Qihao, LIAO Pengfei, MAO Yin, et al. Design and optimization of high sensitivity capacitive flexible pressure sensors[J]. Sensors and Microsystems, 2023, 42(4): 107-110(in Chinese).
[15] MA Z, ZHANG K, YANG S, et al. High-performance capacitive pressure sensors fabricated by introducing dielectric filler and conductive filler into a porous dielectric layer through a biomimic strategy[J]. Composites Science and Technology, 2022, 227: 109595. DOI: 10.1016/j.compscitech.2022.109595
[16] KE K, MCMASTER M, CHRISTOPHERSON W, et al. Highly sensitive capacitive pressure sensors basedon elastomer composites with carbon filler hybrids[J]. Composites Part A: Applied Science and Manufacturing, 2019, 126: 105614. DOI: 10.1016/j.compositesa.2019.105614
[17] BI G, XIAO B, LIN Y, et al. Modeling and optimization of sensitivity and creep for multi-component sensing materials[J]. Nanomaterials, 2023, 13(2): 298. DOI: 10.3390/nano13020298
[18] 王苏, 白元元, 王书琪, 等. 基于MXene/多壁碳纳米管的柔性压力传感器[J]. 传感器与微系统, 2022, 41(7): 5-8. WANG Su, BAI Yuanyuan, WANG Shuqi, et al. Flexible pressure sensor based on MXene/multi-walled carbon nanotubes[J]. Sensors and Microsystems, 2022, 41(7): 5-8(in Chinese).
[19] CHEN X, WEI Z, HE K. An estimation of the discharge exponent of a drip irrigation emitter by response surface methodology and machine learning[J]. Water, 2022, 14(7): 1034. DOI: 10.3390/w14071034
[20] 胡欣颖, 李洪军, 李少博, 等. 对比研究响应面法和BP神经网络-粒子群算法优化调理松板肉加工工艺[J]. 食品与发酵工业, 2019, 45(24): 179-187. HU Xinying, LI Hongjun, LI Shaobo, et al. Comparative study of response surface methodology and BP neural network-particle swarm algorithm for optimization of seasoned pine board meat processing process[J]. Food and Fermentation Industry, 2019, 45(24): 179-187(in Chinese).
[21] LI X, CHEN S, ZHANG J, et al. Optimization of ultrasonic-assisted extraction of active components and antioxidant activity from polygala tenuifolia: A comparative study of the response surface methodology and least squares support vector machine[J]. Molecules, 2022, 27(10): 3069. DOI: 10.3390/molecules27103069
[22] XUE J, SHEN B. Dung beetle optimizer: A new meta-heuristic algorithm for global optimization[J]. The Journal of Supercomputing, 2023, 79(7): 7305-7336. DOI: 10.1007/s11227-022-04959-6
[23] MIRJALILI S. Genetic algorithm[M]//MIRJALILI S. Evolutionary Algorithms and Neural Networks: Theory and Applications. Cham: Springer International Publishing, 2019: 43-55.
[24] KENNEDY J, EBERHART R. Particle swarm optimization[C]. Neural Networks: IEEE International Conference, 1995, 4: 1942-1948.
[25] 隋东, 杨振宇, 丁松滨, 等. 基于EMSDBO算法的无人机三维航迹规划[J]. 系统工程与电子技术, 2024, 46(5): 1756-1766. SUI Dong, YANG Zhenyu, DING Songbin, et al. Three-di-mensional trajectory planning for unmanned aircraftbased on EMSDBO algorithm[J]. Systems Engineering and Electronics, 2024, 46(5): 1756-1766(in Chinese).
[26] 周亚中, 何怡刚, 邢致恺, 等. 基于IDBO-ARIMA的电力变压器振动信号预测[J]. 电子测量与仪器学报, 2023, 37(8): 11-20. ZHOU Yazhong, HE Yigang, XING Zhikai, et al. Vibration signal prediction of power transformer based on IDBO-ARIMA[J]. Journal of Electronic Measurement and Instrumentation, 2023, 37(8): 11-20(in Chinese).
[27] KHAN M Z, YOUSUF R I, SHOAIB M H, et al. A hybrid framework of artificial intelligence-based neural network model (ANN) and central composite design (CCD) in quality by design formulation development of orodispersible moxifloxacin tablets: Physicochemical evaluation, compaction analysis, and its in-silico PBPK modeling[J]. Journal of Drug Delivery Science and Technology, 2023, 82: 104323. DOI: 10.1016/j.jddst.2023.104323
[28] 王建军, 白鹏翔, 董杰, 等. 基于硅烷偶联剂改性的炭黑-石墨烯在天然胶中的性能研究[J]. 橡塑技术与装备, 2023, 49(4): 16-20. WANG Jianjun, BAI Pengxiang, DONG Jie, et al. Study on the properties of carbon black-graphene in natural rubber based on silane coupling agent modification[J]. Rubber and Plastic Technology and Equipment, 2023, 49(4): 16-20(in Chinese).
[29] 田玉玉, 何韧, 吴菊英, 等. 电容式柔性压力传感器的性能优化原理及研究进展[J]. 材料导报, 2023(16): 1-23. TIAN Yuyu, HE Ren, WU Juying, et al. Principles of performance optimization and research progress of capacitive flexible pressure sensors[J]. Materials Reports, 2023(16): 1-23(in Chinese).
[30] XU J, WONG C P. Low-loss percolative dielectric composite[J]. Applied Physics Letters, 2005, 87(8): 082907. DOI: 10.1063/1.2032597
[31] SHEN Y, LIN Y H, NAN C W. Interfacial effect on dielectric properties of polymer nanocomposites filled with core/shell-structured particles[J]. Advanced Functional Materials, 2007, 17(14): 2405-2410. DOI: 10.1002/adfm.200700200
[32] YANG M, LI W, ZHAO Z, et al. Micromechanical modeling for the temperature-dependent yield strength of polymer-matrix nanocomposites[J]. Composites Science and Technology, 2022, 220: 109265. DOI: 10.1016/j.compscitech.2022.109265
[33] KESHTEGAR B, HEDDAM S, SEBBAR A, et al. SVR-RSM: A hybrid heuristic method for modeling monthly pan evaporation[J]. Environmental Science and Pollution Research, 2019, 26(35): 35807-35826. DOI: 10.1007/s11356-019-06596-8
[34] 张娜, 赵泽丹, 包晓安, 等. 基于改进的Tent混沌万有引力搜索算法[J]. 控制与决策, 2020, 35(4): 893900. ZHANG Na, ZHAO Zedan, BAO Xiao'an, et al. Improved tent-based chaotic universal gravity search algorithm[J]. Control and Decision Making, 2020, 35(4): 893900(in Chinese).
[35] 宁杰琼, 何庆. t-分布扰动策略和变异策略的花授粉算法[J]. 小型微型计算机系统, 2021, 42(1): 64-70. DOI: 10.3969/j.issn.1000-1220.2021.01.012 NING Jieqiong, HE Qing. Flower pollination algorithms with t-distribution perturbation strategy and variation strategy[J]. Small Microcomputer Systems, 2021, 42(1): 64-70(in Chinese). DOI: 10.3969/j.issn.1000-1220.2021.01.012
[36] 郭琴, 郑巧仙. 多策略改进的蜣螂优化算法及其应用[J]. 计算机科学与探索, 2024, 18(4): 930-946. GUO Qin, ZHENG Qiaoxian. Multi-strategy improved dung beetle optimization algorithm and its applications[J]. Computer Science and Exploration, 2024, 18(4): 930-946(in Chinese).
[37] LI S, LI J. Chaotic dung beetle optimization algorithm based on adaptive t-distribution[C]//2023 IEEE 3rd International Conference on Information Technology, Big Data and Artificial Intelligence (ICIBA). Chongqing, China: IEEE, 2023: 925-933.
[38] 苏国士, 梁阚, 李虓, 等. 石墨烯/碳纳米管复合导电剂制备[J]. 炭素技术, 2022, 41(1): 23-27, 40. SU Guoshi, LIANG Kan, LI Xiao, et al. Preparation of graphene/carbon nanotube composite conductive agent[J]. Carbon Technology, 2022, 41(1): 23-27, 40(in Chinese).
[39] 苏志强, 张晓媛, 赵鑫, 等. 基于碳纳米管/石墨烯界面修饰的碳纤维增强复合材料中力-电耦合关系探究[J]. 长春工业大学学报, 2022, 43(Z1): 354-359. SU Zhiqiang, ZHANG Xiaoyuan, ZHAO Xin, et al. Investigation of force-electricity coupling relationship in carbon fiber reinforced composites based on carbon nanotube/graphene interfacial modification[J]. Journal of Changchun University of Technology, 2022, 43(Z1): 354-359(in Chinese).
[40] COLONNA S, BERNAL M M, GAVOCI G, et al. Effect of processing conditions on the thermal and electrical conductivity of poly (butylene terephthalate) nanocomposites prepared via ring-opening polymerization[J]. Materials & Design, 2017, 119: 124-132.
[41] JAHANI Y, BAENA M, BARRIS C, et al. Influence of curing, post-curing and testing temperatures on mechanical properties of a structural adhesive[J]. Construction and Building Materials, 2022, 324: 126698. DOI: 10.1016/j.conbuildmat.2022.126698
[42] 赵珂. 基于三维竖直石墨烯的微结构柔性压力传感器[D]. 太原: 山西大学, 2023. ZHAO Ke. Microstructured flexible pressure sensor based on 3D vertical graphene[D]. Taiyuan: Shanxi University, 2023(in Chinese).
[43] 王菲菲, 彭海益, 姚晓刚. 基于多向冷冻法制备的高灵敏度柔性电容式压力传感器[J]. 复合材料学报, 2023, 40(5): 2680-2687. WANG Feifei, PENG Haiyi, YAO Xiaogang. Highly sensitive flexible capacitive pressure sensor prepared based on multidirectional freezing method[J]. Acta Materiae Compositae Sinica, 2023, 40(5): 2680-2687(in Chinese).
[44] YAN S, TANG Y, BI G, et al. Optimal design of carbon-based polymer nanocomposites preparation based on response surface methodology[J]. Polymers, 2023, 15(6): 1494. DOI: 10.3390/polym15061494
[45] 张鹏, 陈昱丞, 张建, 等. 基于双层微结构电极的柔性电容式压力传感器[J]. 仪表技术与传感器, 2020(5): 11-13, 17. DOI: 10.3969/j.issn.1002-1841.2020.05.003 ZHANG Peng, CHEN Yucheng, ZHANG Jian, et al. Flexible capacitive pressure sensor based on double-layer microstructured electrodes[J]. Instrumentation Technology and Sensors, 2020(5): 11-13, 17(in Chinese). DOI: 10.3969/j.issn.1002-1841.2020.05.003
-
期刊类型引用(4)
1. 曹邵文,周国庆,蔡琦琳,叶庆,庞昊强,吴玺. 太阳能电池综述:材料、政策驱动机制及应用前景. 复合材料学报. 2022(05): 1847-1858 .  本站查看
本站查看
2. 刘玉梅,温馨,孟翔飞. 基于技术轨道跃迁的突破性技术预测方法及应用研究. 情报杂志. 2021(11): 39-45+15 . 百度学术
3. 王明序,许子傲,葛明桥,高强. 浅色导电纤维的发展及其最新应用. 丝绸. 2020(01): 37-42 . 百度学术
4. 刘璇,李必奎,李明,王鹏波. 铜基碳纳米管复合薄膜载流性能分析. 化工进展. 2018(12): 4782-4790 . 百度学术
其他类型引用(2)
-


计量
- 文章访问数: 234
- HTML全文浏览量: 179
- PDF下载量: 26
- 被引次数: 6
