

Statistical distribution pattern of strength and microstructural damage analysis of unidirectional fiber bundle SiC/SiC composites
-
摘要: SiC/SiC复合材料力学性能离散性来源于其结构单元和微结构特征。本文针对结构最简单的单向纤维束SiC/SiC复合材料,通过双参数Weibull分布和中位估计分布分析其强度分布规律,基于该复合材料各组元(基体、界面相、纤维)微结构的深度学习来揭示其离散性。结果表明:小试炉和中试炉制备的单向纤维束SiC/SiC的拉伸强度分别位于(331.02 MPa,407.82 MPa)和(161.09 MPa,540.95 MPa);前者威布尔模数(20.59)比后者(5.01)高出75.7%,表明中试的离散性增大。断口形貌深度学习结果表明:基体开裂、界面偏转和纤维断裂拔出是主要的失效机制,定量分析得到基体裂纹间距分布于(83.2 μm,107.8 μm),通过细观力学公式计算表明基体非均匀性为影响复合材料可靠性的主要原因。
-
关键词:
- 单向纤维束SiC/SiC /
- 微结构 /
- Weibull分布 /
- 深度学习 /
- 拉伸性能
Abstract: The discrete mechanical properties of SiC/SiC composites originate from their structural units and microstructural features. In this paper, for the unidirectional fiber bundle SiC/SiC composites with the simplest structure, the strength distribution pattern was analyzed by the two-parameter Weibull distribution and the median estimated distribution, and the discrete nature was revealed based on the deep learning of the microstructure of each group element (matrix, interface phase, and fiber) of the composites. The results show that the tensile strengths of the unidirectional fiber bundle SiC/SiC prepared in the small and medium test furnaces are located at (331.02 MPa, 407.82 MPa) and (161.09 MPa, 540.95 MPa), respectively. The former Weibull modulus (20.59) is 75.7% higher than the latter (5.01), indicating an increase in the dispersion of the medium test. The results of deep learning of fracture morphology show that matrix cracking, interface deflection and fiber fracture pullout are the main failure mechanisms, and due to the distribution of matrix crack spacing at (83.2 μm, 107.8 μm), the calculation by the micromechanical equation indicates that matrix nonuniformity is the main reason affecting the reliability of the composites. -
连续碳化硅纤维增韧碳化硅陶瓷基复合材料(SiC/SiC)具备高强度、耐高温、低密度等特点,可作为新型航空发动机的优选材料之一[1-5]。随着SiC/SiC复合材料应用范围愈加广泛,不仅应用于航空领域,在化工领域中也是制造密封环的理想材料,在核聚变反应堆中可用于包层结构、包层流道内衬和转换器等方面[6],这些尖端领域均对复合材料的稳定性提出要求。化学气相渗透法(CVI)工艺导致陶瓷基复合材料(CMC)内部普遍存在一些缺陷(束内外孔隙、分层、预制体铺层错位和基体开裂等),故其力学性能具有较大的离散性,强度作为结构设计的一项重要参数势必会受到其离散性的影响,从而限制结构的高可靠性设计。
CMC成型编织和致密化工艺复杂,易形成损伤源,有必要综合考虑制备工艺中的损伤对复合材料力学性能的影响,建立概率论可靠性模型[7]。大量研究表明CMC拉伸强度服从Weibull分布[8-13]。陶永强等[14]通过渐进损伤的简化剪滞理论得到了各层应力分布及90°层裂纹密度与施加应力之间的关系;Curtin等[15]基于基体裂纹随机开裂、纤维随机破坏理论,对单向增强CMC的应力-应变行为进行了模拟;孟志新等[16]探究了不同纤维束下SiC CMC的拉伸行为;Vagaggini等[17]计算了界面性能参数对复合材料拉伸行为的影响,表明增大界面脱粘能和界面滑移应力利于提高拉伸强度。目前CMC已实现工程化应用,评估工艺放大对复合材料性能分散性的影响成为主要的技术问题,分析单向纤维束复合材料拉伸强度的可靠性,评估结构单元和微结构特征对分散性的影响,也是该材料由小试走向中试的重要环节,小试指实验室开发优化阶段,中试指在小试的基础上继续放大、量产化。关于各组元对CMC性能影响的研究已有很多报道,但是关于小试炉与中试炉对CMC力学性能及其各组元影响的研究鲜有报道。
本文采用CVI技术分别在小试炉与中试炉中制备了单向纤维束SiC/SiC复合材料(Mini-SiC/SiC)的两批试样,探究工艺放大制备对复合材料力学性能离散的影响,并讨论造成复合材料力学性能离散的来源。其中小试炉为实验室制备,一台CVI沉积炉,中试为90台沉积炉,小试炉膛直径为600 mm,中试炉膛直径为1200 mm。通过双参数Weibull分布模型对Mini-SiC/SiC复合材料强度分布和可靠性进行分析,并基于双参数Weibull分布损伤模型建立拉伸载荷-位移关系,最终采用ORS Dragonfly软件分割各组元,结合基体间距裂纹公式分析分散性对可靠性的影响。
1. 材料制备与测试分析
1.1 Mini-SiC/SiC复合材料的制备
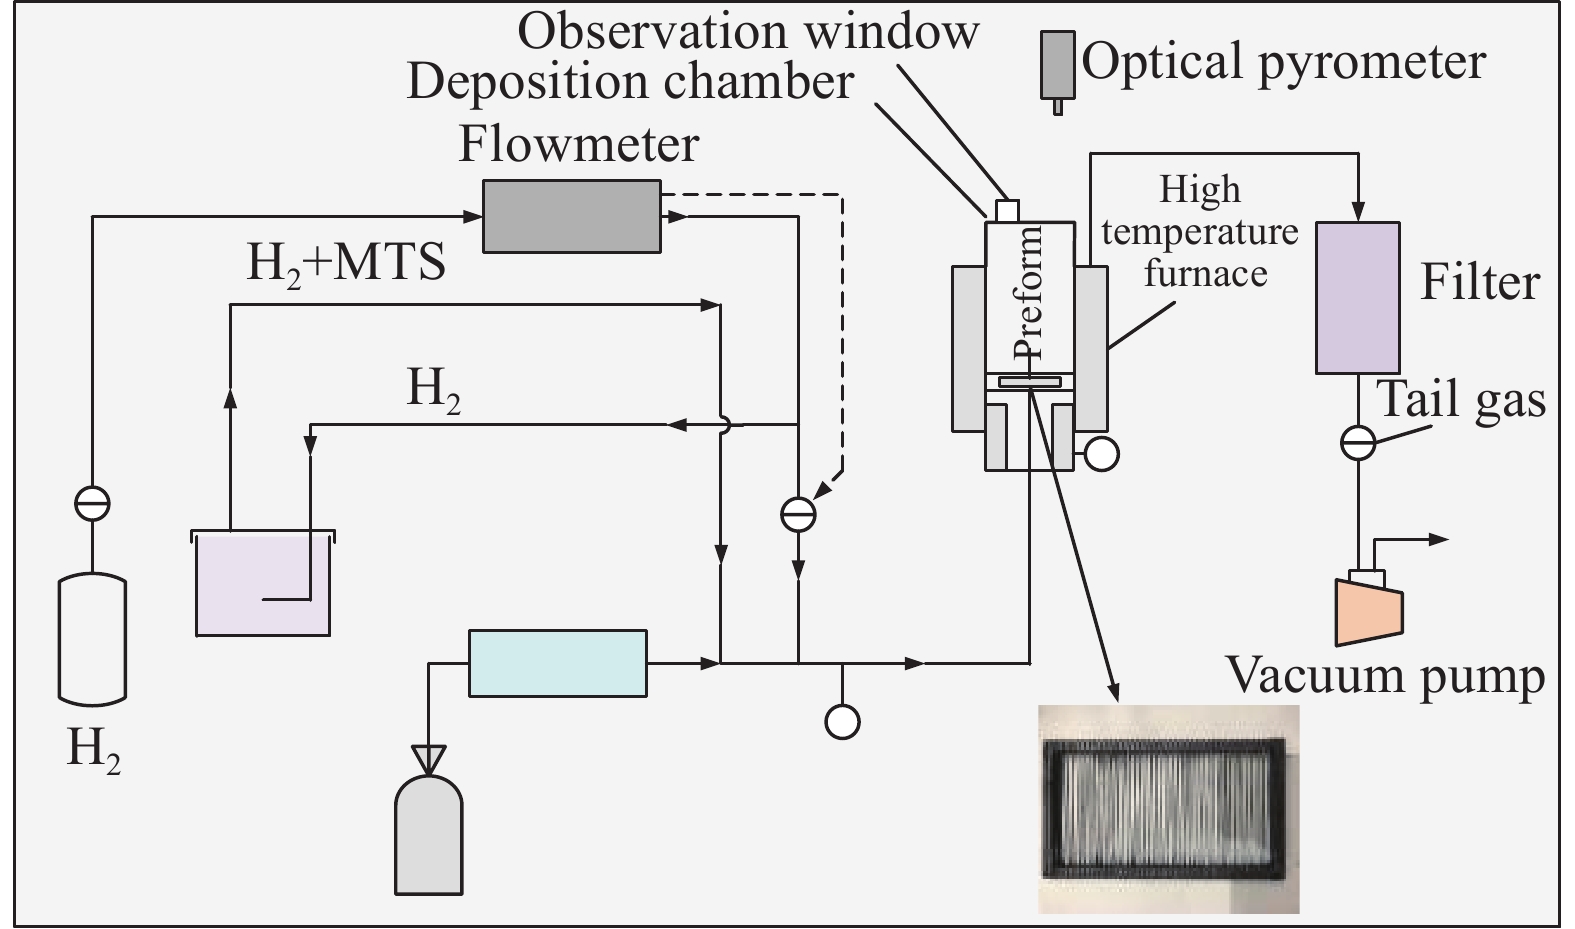
采用CVI法制备Mini-SiC/SiC复合材料,见图1。首先,均匀地将SiC纤维束缠绕到石墨框上,获得纤维预制体。然后,在纤维预制体表面沉积BN界面层,其中以BCl3作为硼源,NH3作为氨源,Ar为稀释气体,沉积温度600℃[18]。最后,将沉积BN界面层的SiC纤维预制体在化学气相沉积炉中浸渗SiC基体,选择三氯甲基硅烷(MTS)为SiC基体的源物质,以H2为载气,Ar为稀释气体,MTS与H2摩尔比1∶10,沉积温度1150℃。Mini-SiC/SiC复合材料制备工艺参数如表1所示,Mini-SiC/SiC A为小试炉制备(炉膛直径为600 mm),Mini-SiC/SiC B为中试炉制备(炉膛直径为1200 mm),小试炉制备复合材料平均密度为3.09 g/cm2,中试炉制备复合材料平均密度为3.07 g/cm2。SiC纤维耐温为1350℃,故制备温度对其影响不大。
![]() 图 1 单向纤维束SiC/SiC (Mini-SiC/SiC)复合材料制备示意图Figure 1. Schematic diagram of preparation of unidirectional fiber bundle SiC/SiC (Mini-SiC/SiC) compositesMTS—Methyltrichlorosilane表 1 Mini-SiC/SiC复合材料的制备工艺参数Table 1. Process parameters of Mini-SiC/SiC composites
图 1 单向纤维束SiC/SiC (Mini-SiC/SiC)复合材料制备示意图Figure 1. Schematic diagram of preparation of unidirectional fiber bundle SiC/SiC (Mini-SiC/SiC) compositesMTS—Methyltrichlorosilane表 1 Mini-SiC/SiC复合材料的制备工艺参数Table 1. Process parameters of Mini-SiC/SiC compositesMaterial name Deposition time/h Inside diameter/mm BN interface SiC matrix Mini-SiC/SiC A 100 160 600 Mini-SiC/SiC B 100 160 1200 Notes: Mini-SiC/SiC A—Preparation in a small test furnace (Furnace diameter of 600 mm); Mini-SiC/SiC B—Preparation in a pilot test furnace (Furnace diameter of 1200 mm). 1.2 力学测试与分析方法
拉伸测试在美特斯(MTS)公司生产的CMT6203型微机控制电子万能试验机上进行。实验执行标准为GB/T 1040.5—2008[19],标距50 mm,加载速度3 mm/min。其拉伸测试特定夹具组件见图2。
Mini-SiC/SiC复合材料性能分析,采用以概率论为根据的结构可靠性模型,基于双参数Weibull分布模型对Mini-SiC/SiC复合材料的强度分布和可靠性进行分析。
1.3 表征与分析
采用扫描电子显微镜(SEM,SU3800,日本日立)观察Mini-SiC/SiC复合材料的显微结构和微观形貌。ORS Dragonfly软件在阈值分割的基础上,对Mini-SiC/SiC复合材料断层扫描(CT,AX-2000,宁波奥影检测)图像使用深度学习工具分割出灰度值相近的部分进行处理[20]。
2. 结果与讨论
2.1 Mini-SiC/SiC复合材料非线性拉伸行为
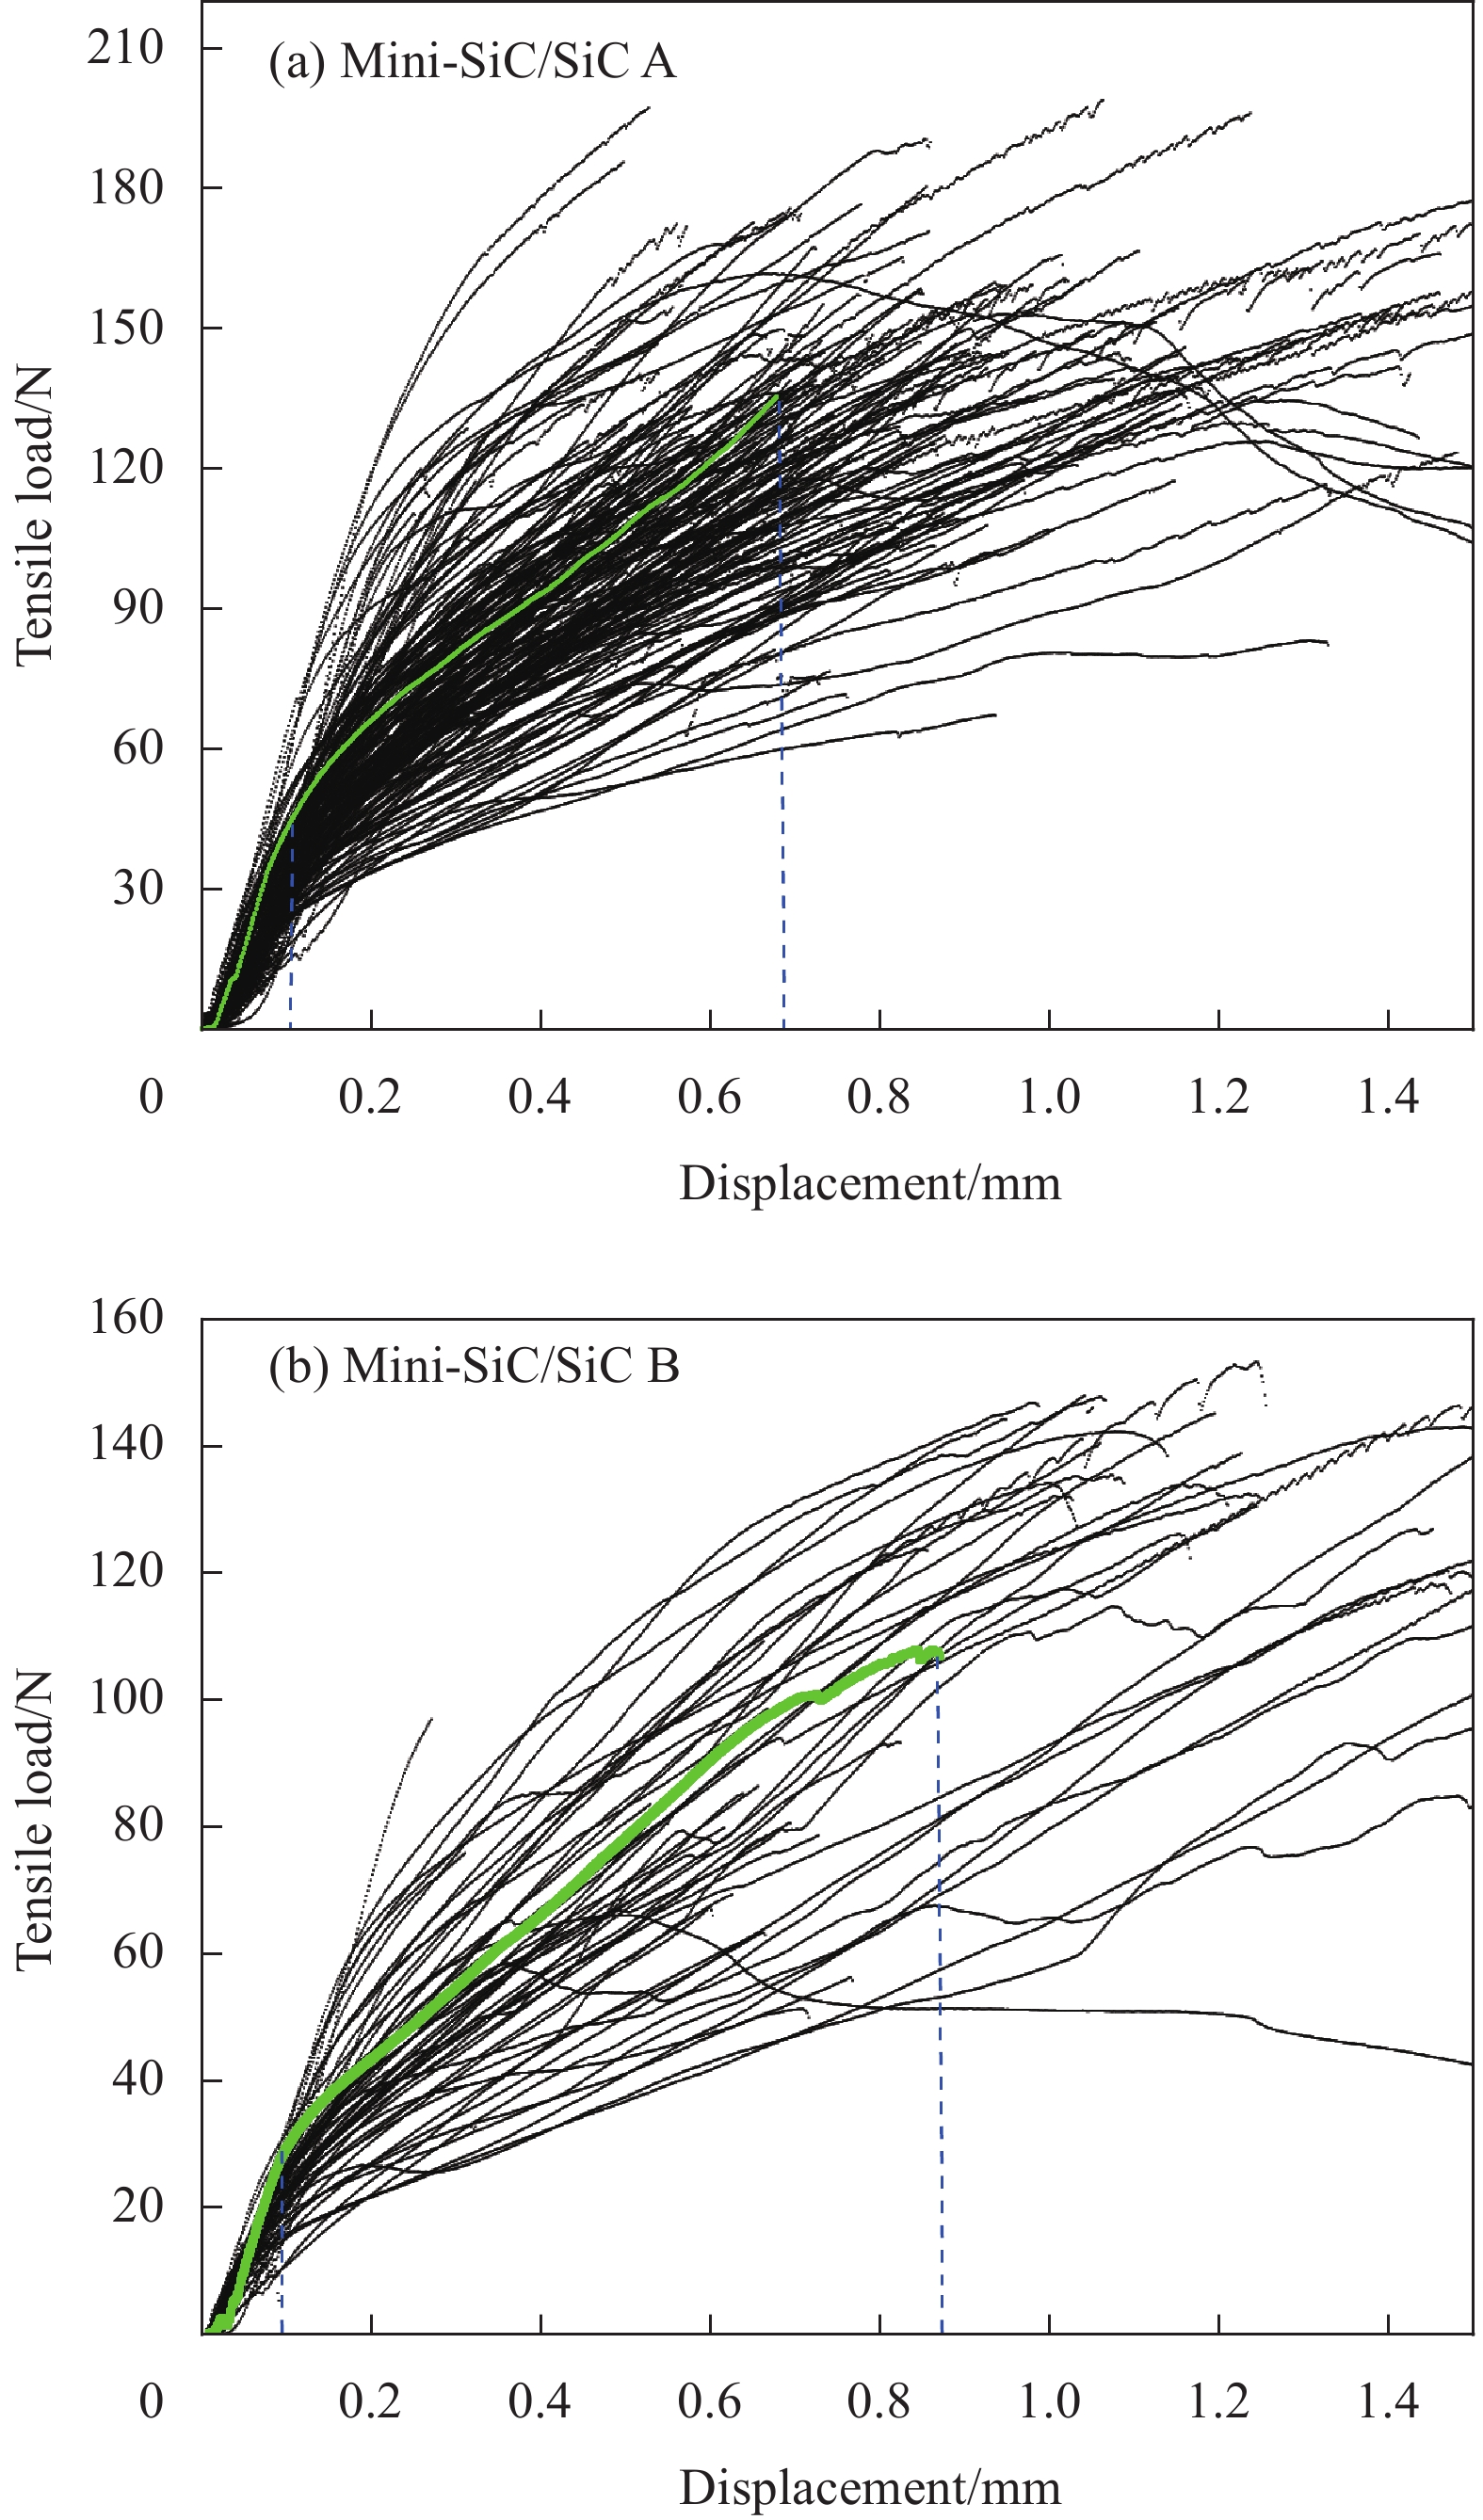
图3为典型Mini-SiC/SiC复合材料载荷-位移曲线。该图由两组曲线组成,图3(a)、3(b)分别为小试炉与中试炉制备,可见曲线规律一致,故各选取其中一条曲线分析,曲线分三阶段:第一阶段加载初期,复合材料整体发生弹性变形,拉伸曲线斜率保持不变;第二阶段曲线呈非线性,且斜率逐渐减小,SiC基体产生新裂纹,随应力增加而增多;当达到最大载荷时曲线进入第三阶段,该阶段曲线未表现出韧性现象,呈现当基体裂纹达到饱和时,直接发生脆性断裂,其断口主要以纤维单丝形式拔出,未出现纤维簇形式拔出。
![]() 图 3 Mini-SiC/SiC复合材料典型的拉伸载荷-位移曲线Figure 3. Typical tensile load-displacement curves of Mini-SiC/SiC composites
图 3 Mini-SiC/SiC复合材料典型的拉伸载荷-位移曲线Figure 3. Typical tensile load-displacement curves of Mini-SiC/SiC composites2.2 Mini-SiC/SiC复合材料拉伸强度统计分布规律
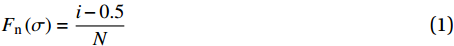
采用中位估计法获取材料强度分布,计算每个强度所对应的失效概率,该失效概率为试验估计值。中位估计法失效概率估计值Fn可表示为
Fn(σ)=i−0.5N (1) 式中:i为强度从小到大排列的序数,即强度σ所对应的序号,i的最大值为 N;N为样本总量。
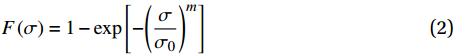
双参数Weibull分布模型累积失效分布函数F(σ) 数学表达式为
F(σ)=1−exp[−(σσ0)m] (2) 式中:
σ0 为尺度参数,当 σ0=σ时,Weibull函数取最大值;m为形状参数,表示材料强度的分布规则,m越大,强度分散性越小。将式(2)整理得:
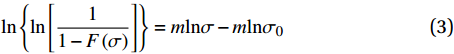
ln{ln[11−F(σ)]}=mlnσ−mlnσ0 (3) 由式(3)将
ln{ln[1/(1−F(σ))]} 作为y轴,lnσ作为x轴,可得:y=mx−mlnσ0 (4) 将式(4)进行作图,并线性拟合分析,由此可得m和σ0值。
2.2.1 参数估计方法
Weibull分布参数求解及检验主要数据(见附录表4),线性拟合如图4所示。以Mini-SiC/SiC A复合材料为例,进行双参数Weibull分布模型的参数估计。
![]() 图 4 Mini-SiC/SiC复合材料拉伸强度Weibull分布的线性拟合图Figure 4. Linear fitting diagram of Weibull distribution of tensile strength of Mini-SiC/SiC compositesFn(σ)—Failure probability; σ—Strength value
图 4 Mini-SiC/SiC复合材料拉伸强度Weibull分布的线性拟合图Figure 4. Linear fitting diagram of Weibull distribution of tensile strength of Mini-SiC/SiC compositesFn(σ)—Failure probability; σ—Strength value由图4(a)可得,Mini-SiC/SiC A线性拟合曲线函数为
y=20.59x−122.03 (5) 由此可知,m=20.59,σ0=374.79 MPa。同理可得,Mini-SiC/SiC B的m=5.01,σ0=400.74 MPa,前者m值大于后者,表明小试炉制备稳定性更优。此外,Weibull分布参数和线性相关系数如表2所示。由表可得,线性相关系数r都接近于1,变量之间存在高度相关性,线性拟合合理,因此m与σ0接近真实值。
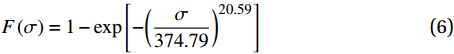
表 2 两种Mini-SiC/SiC复合材料拉伸强度双参数Weibull分布的参数和线性相关系数Table 2. Parameters and linear correlation coefficient of two-parameter Weibull distribution for tensile strength of two Mini-SiC/SiC compositesName Shape parameter b Scale parameter a/mm r Mini-SiC/SiC A 20.59 374.79 0.94 Mini-SiC/SiC B 5.01 400.74 0.98 将上述得到的m和σ0代入式(2),Mini-SiC/SiC A复合材料的双参数Weibull累积失效分布函数可表示为
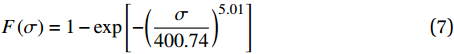
F(σ)=1−exp[−(σ374.79)20.59] (6) 同理可得,Mini-SiC/SiC B的双参数Weibull累积失效分布函数可表示为
F(σ)=1−exp[−(σ400.74)5.01] (7) 图5为两种Mini-SiC/SiC复合材料双参数Weibull累积失效分布函数曲线与中位估计数据曲线对比图。分析可知,分别采用式(6)、式(7)计算的曲线与中位估计法得到的曲线能够较好吻合。因此,拉伸强度分布规律能够采用双参数Weibull分布模型表征,且效果较好。
![]() 图 5 Mini-SiC/SiC复合材料Weibull累积分布函数曲线与中位估计数据的对比Figure 5. Weibull cumulative distribution function curve compared with the median estimated data for Mini-SiC/SiC composites
图 5 Mini-SiC/SiC复合材料Weibull累积分布函数曲线与中位估计数据的对比Figure 5. Weibull cumulative distribution function curve compared with the median estimated data for Mini-SiC/SiC composites为检验Mini-SiC/SiC A复合材料拉伸强度与双参数Weibull分布的拟合优度。本文引入Kolmogorov-Smirnov(K-S)检验,可通过样本观测值的失效概率估计值Fn(σ)与假设的双参数Weibull累积失效概率分布F(σ)的差值进行对比分析,从而确定该失效概率的分布类型。
Fn(σ)与F(σ)的最大差值DN由下式得出:
DN=max|Fn(σ)−F(σ)| (8) Fn(σ)和F(σ)在上文中已完成计算,前者由中位估计法获得,后者则通过双参数Weibull分布函数计算得到,都代表材料在强度达到σ时发生失效的概率。DN数据见附录表4。
工程上一般采取显著水平α=0.05或α=0.01。经查阅DN临界值表,当N大于35,DN临界值等于D35与
√N 的比值,如附录表1所示。当复合材料Mini-SiC/SiC A拉伸强度为356.48 MPa时(附录表4),Kolmogorov距离取最大值DN=0.1252<D60,0.05=0.1756<D60,0.01=0.2104,可知DN小于显著水平α=0.05和α=0.01的DN临界标准值。
采用相同方法可检验Mini-SiC/SiC B拉伸强度是否服从双参数Weibull分布,检验结果数据如附录表2所示。由表可知,DN分别为0.0995均小于D60,0.01和D60,0.05,故拉伸强度均服从双参数Weibull分布,且拟合优度良好。
根据K-S检验可知,DN小于显著水平α=0.05和α=0.01的DN临界标准值。故拉伸强度均服从双参数Weibull分布,且拟合优度良好。
可靠度R是度量可靠性的标准,其与失效概率关系可表示为
R(σ)=1−F(σ) (9) 该式意味着给定任意强度,都可计算出其可靠度为多大,并随着强度增大,失效概率会增大,可靠度会减小。由于给出任意强度数据便可计算其可靠度,因此对于每个给定的可靠度,也可以计算出相应的可靠拉伸强度。联立式(2)和式(9)并求反函数,可获得给定可靠度下的可靠拉伸强度σ如下式:
σ(R)=σ0(ln1R)1m (10) 由此就可获得任意可靠度所对应的可靠强度值。在工程上,一般将5%、25%、50%、75%、95%可靠度作为可靠质量标准。5个可靠度下的可靠拉伸强度值如附录表3所示。同时,不同可靠度下的可靠拉伸强度如附录图1所示。
研究表明,可靠度为50%时的可靠拉伸强度与平均拉伸强度较为接近,表3给出了可靠度为50%的可靠拉伸强度与平均拉伸强度。由表中数据通过计算绝对偏差和相对偏差可知:最大绝对偏差仅4.69 MPa,最大相对偏差仅1.2%。因此,采用平均拉伸强度可准确预测50%可靠度所对应的可靠强度,且误差较小。
表 3 两种Mini-SiC/SiC复合材料在可靠度50%时的可靠拉伸强度与平均拉伸强度Table 3. Reliable tensile strength and average tensile strength of two Mini-SiC/SiC composites at 50% reliabilityName Mean tensile strength/MPa Tensile strength of 50% reliability/MPa Absolute deviation/MPa Relative deviation/% Mini-SiC/SiC A 365.08 368.18 3.10 0.8 Mini-SiC/SiC B 367.78 372.47 4.69 1.2 2.3 Mini-SiC/SiC复合材料拉伸载荷与位移关系的确定
复合材料拉伸应力σ与载荷P关系为
σ=PS (11) 复合材料拉伸应变ε与伸长量∆l关系为
ε=Δll0 (12) 式中:S为材料截面积;
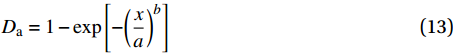
l0 为标距,值为50 mm。材料宏观损伤变量服从双参数Weibull分布,由式(2)与拉伸强度建立联系。在拉伸加载时,损伤贯穿整个过程,故累积损伤量和位移x同样服从双参数Weibull分布。因此累积损伤因子Da随着位移x变化的分布函数可表示为类似于式(2)形式,如下所示:
Da=1−exp[−(xa)b] (13) 由于SiC/SiC复合材料为脆性材料,为便于计算参数a、b,获取Weibull分布模型,因此将x视为断裂位移xmax。
将式(13)整理得:
ln{ln[11−Da]}=blnxmax−blna (14) 可将
ln{ln[1/(1−Da)]} 作为y轴,lnxmax作为x轴,得:y=bxmax−blna (15) SiC/SiC复合材料中,SiC纤维和SiC基体均为脆性材料,各组分材料达到破坏极限前几乎未发生塑性变形。因此,基于双参数Weibull分布的弹性损伤模型表征Mini-SiC/SiC复合材料拉伸加载过程:
P=k(1−Da)x (16) 式中,k为抗拉刚度。
2.3.1 双参数Weibull分布模型参数估计
Weibull分布参数求解及检验的详细数据见附录表5,线性拟合如图6所示。以Mini-SiC/SiC A复合材料为例,进行双参数Weibull分布模型参数估计。
![]() 图 6 Mini-SiC/SiC复合材料断裂位移Weibull分布线性拟合Figure 6. Linear fitting of Weibull distribution for fracture displacement of Mini-SiC/SiC compositesDa—Cumulative damage factor
图 6 Mini-SiC/SiC复合材料断裂位移Weibull分布线性拟合Figure 6. Linear fitting of Weibull distribution for fracture displacement of Mini-SiC/SiC compositesDa—Cumulative damage factorMini-SiC/SiC A复合材料拟合曲线函数为
y=3.09x+0.42 (17) 由此可得,b=3.09,a=0.87 mm。同理可得,Mini-SiC/SiC B的b=2.50,a=1.16 mm。此外,Weibull分布参数和线性相关系数r如表4所示。可知,线性相关系数都接近于1,变量之间存在高度相关关系,线性拟合合理,a与b接近真实数据。
表 4 两种Mini-SiC/SiC复合材料断裂位移双参数Weibull分布参数、线性相关系数Table 4. Weibull distribution parameters and linear correlation coefficients of two Mini-SiC/SiC composites with two-parameter fracture displacementName Shape parameter b Scale parameter a/mm r Mini-SiC/SiC A 3.09 0.87 0.97 Mini-SiC/SiC B 2.50 1.16 0.99 代入参数后,双参数Weibull累积损失因子损伤函数可分别表示为
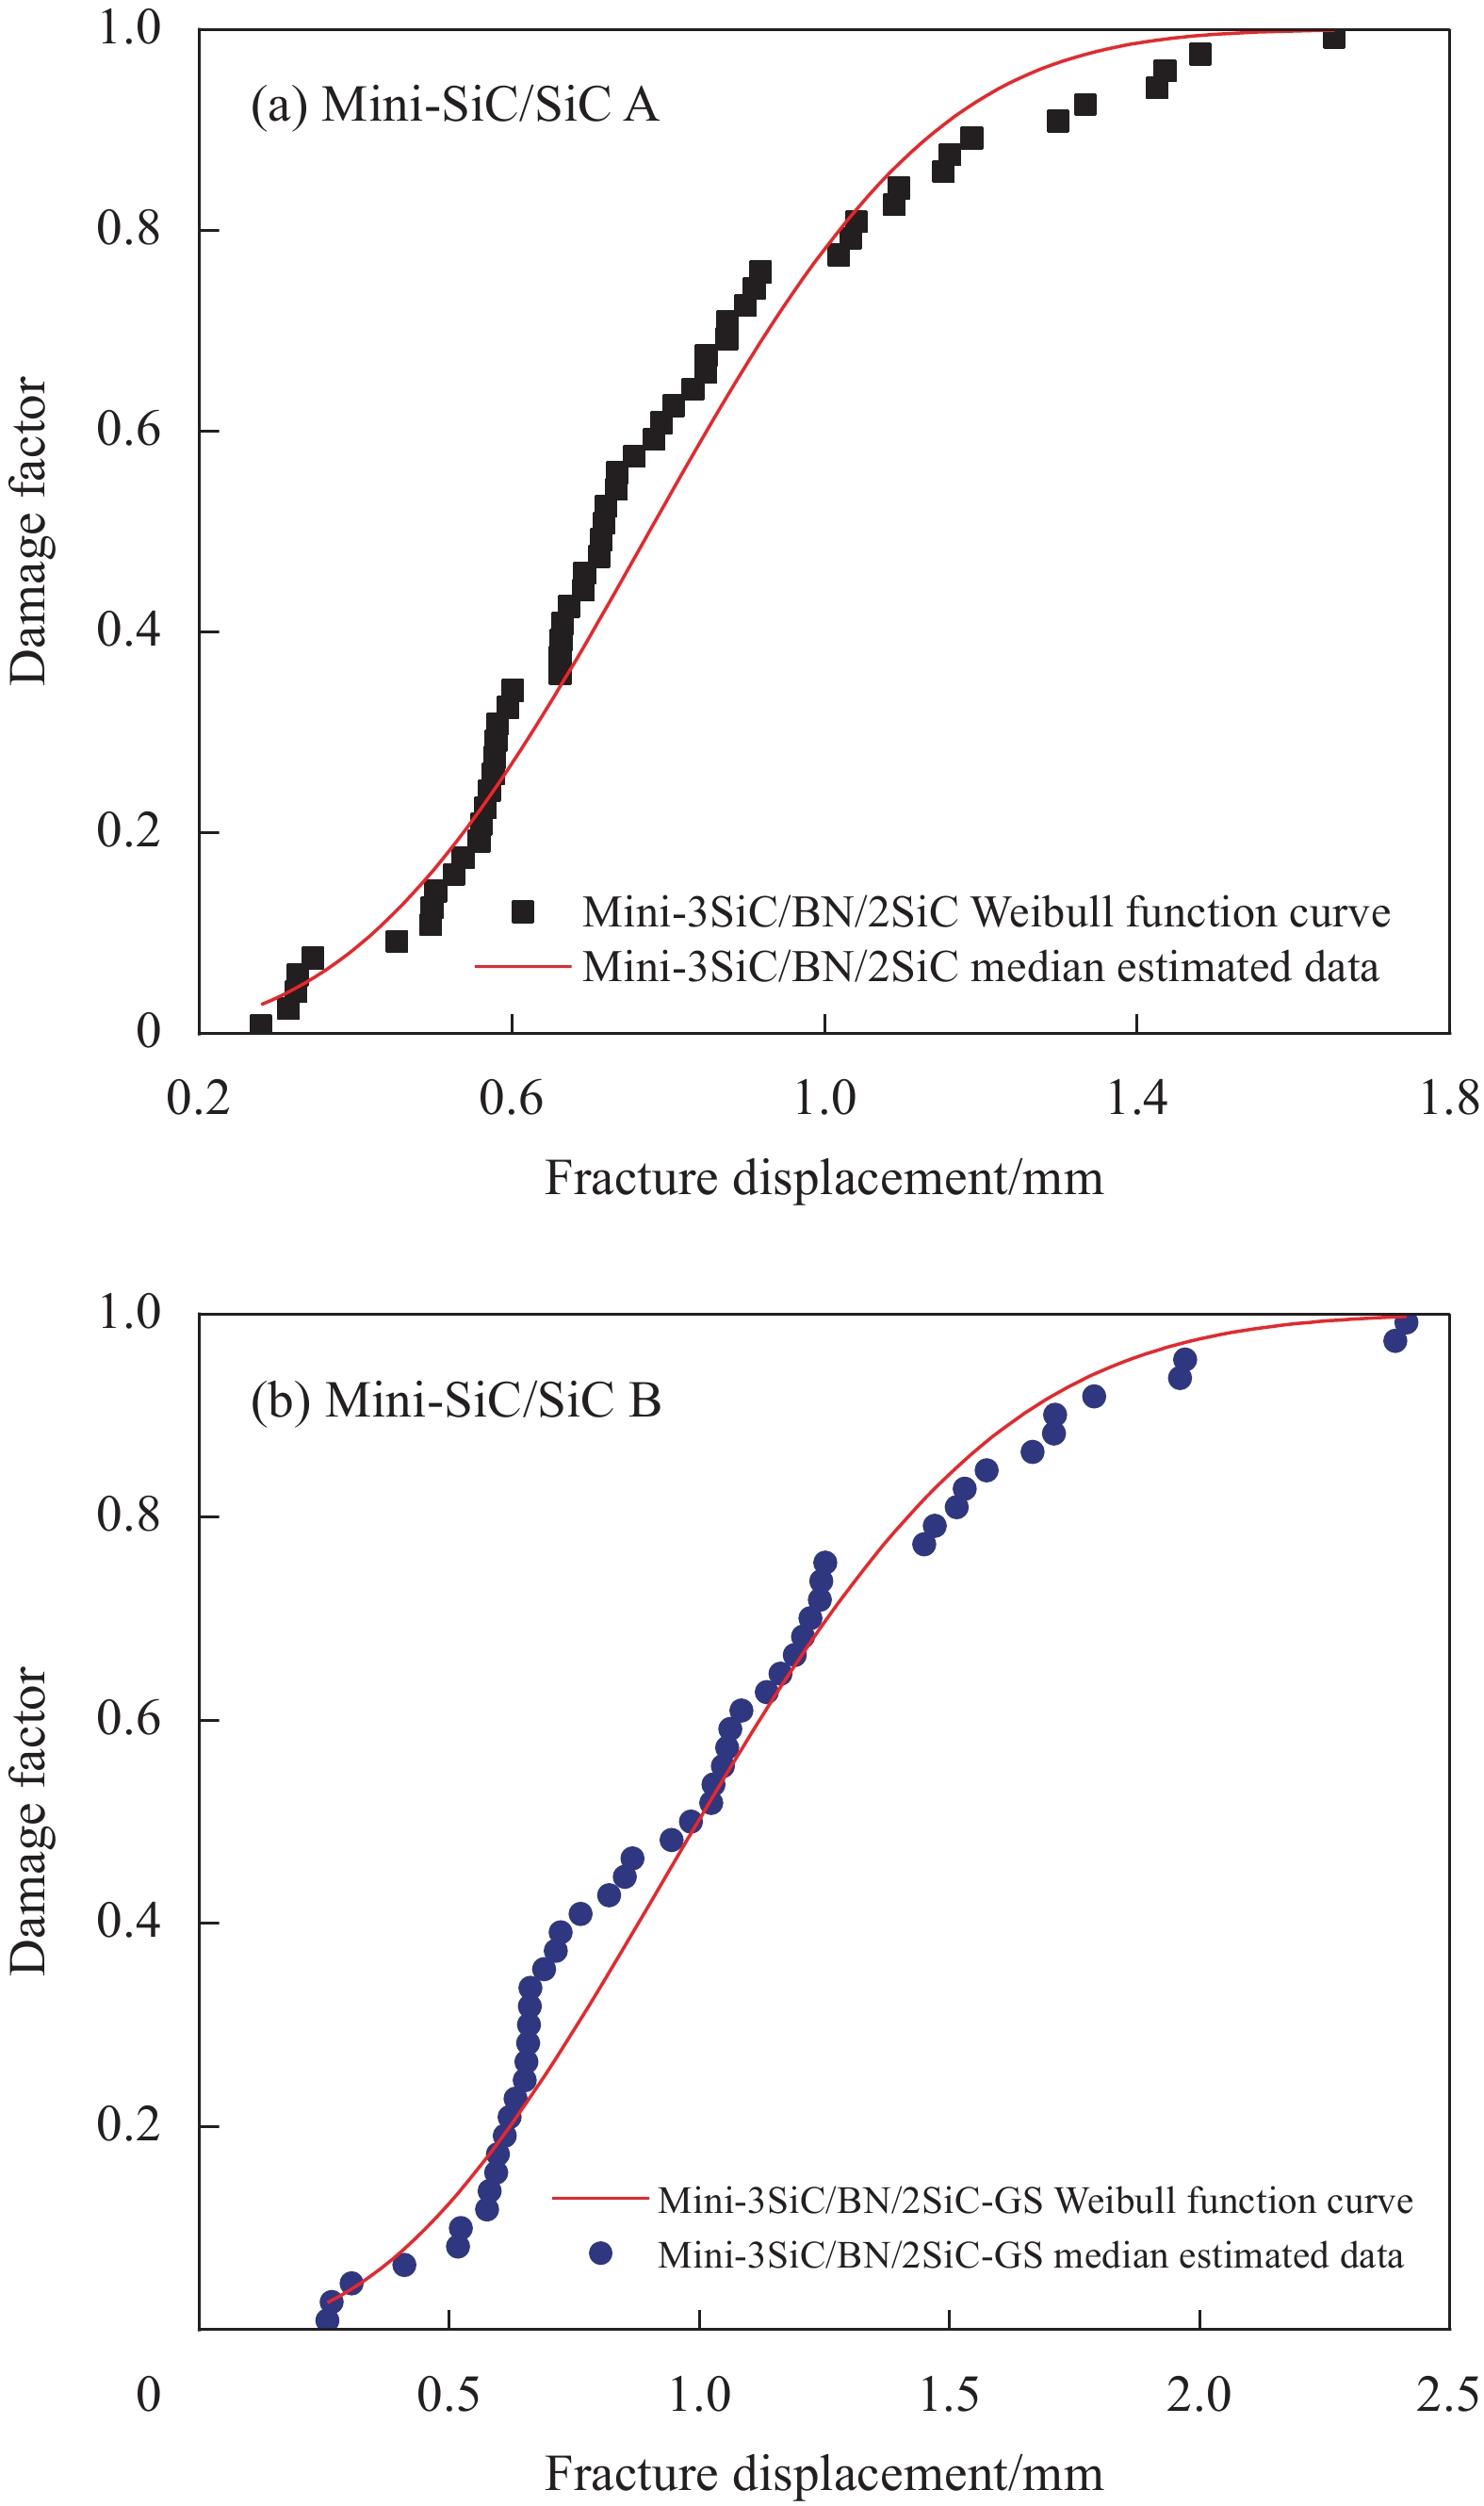
Da=1−exp[−(x0.87)3.09] (18) Da=1−exp[−(x1.16)2.50] (19) 图7为拉伸强度的Weibull累积损伤因子函数拟合结果与试验结果对比图。分析可知,中位估计数据分别和式(18)、式(19)函数曲线吻合较好,因此,双参数Weibull模型能较好地表征累积损伤因子分布规律。
![]() 图 7 Mini-SiC/SiC复合材料Weibull累积损伤因子分布函数曲线与中位估计数据的对比Figure 7. Weibull cumulative damage factor distribution function curves for Mini-SiC/SiC composites compared with median estimated data
图 7 Mini-SiC/SiC复合材料Weibull累积损伤因子分布函数曲线与中位估计数据的对比Figure 7. Weibull cumulative damage factor distribution function curves for Mini-SiC/SiC composites compared with median estimated dataDN为Kolmogorov距离;D60,0.01为样本总量为60,显著水平α取0.01;D60,0.05为样本总量为60,显著水平α取0.05。
采用K-S检验进行拟合优度分析,计算估计值D和Da最大差异值可获得DN。如表5所示,经比对发现,两种材料DN值均小于D60,0.01、D60,0.05,故断裂位移均服从双参数Weibull分布,且拟合优度良好。
表 5 Mini SiC/SiC复合材料的DN与D60,0.01、D60,0.05Table 5. DN and D60,0.01, D60,0.05 of Mini SiC/SiC compositesName DN D60,0.01 D60,0.05 Mini-SiC/SiC A 0.1139 0.2104 0.1756 Mini-SiC/SiC B 0.1036 0.2104 0.1756 Notes: DN—Kolmogorov distance; D60,0.01—Total sample size is 60 and the significance level α is taken as 0.01; D60,0.05—Total sample size is 60 and α is taken as 0.05. 2.3.2 拉伸载荷与位移关系
将式(13)代入式(16)得拉伸载荷-位移关系模型:
P=k(exp[−(xa)b])x (20) 为求解k值,假设拉伸载荷-位移为线性关系。将每个试样断裂位移和最大载荷数据代入式(20),可得每个试样值,取平均值,即为k值。经计算,两种材料k值分别为370.89 N/mm、251.09 N/mm。将a、b、k值代入式(20),得Mini-SiC/SiC A、Mini-SiC/SiC B拉伸载荷-位移模型分别为
P=370.89(exp[−(x0.87)3.09])x (21) P=251.09(exp[−(x1.16)2.50])x (22) 将拉伸应力和载荷关系(式(11))与拉伸应变和加载位移之间的关系(式(12))及拉伸载荷-位移模型(式(20))联立进行求解,得拉伸应力-应变关系如下式:
σ=kexp[−(εl0/a)b]εl0S (23) 代入相关数据得上述两种材料拉伸应力-应变关系分别如下式所示:
σ=370.89exp[−(50ε/0.87)3.09]50εS (24) σ=251.09exp[−(50ε/1.16)2.50]50εS (25) 为验证拉伸应力-应变关系合理性,抽取拉伸强度接近于平均值的试样进行检验。Mini-SiC/SiC A中选取最大载荷128.79 N,断裂位移0.83 mm的试样。Mini-SiC/SiC B中选取最大载荷132.60 N,断裂位移为1.03 mm的试样。求出试样断裂应变εmax后,将该值分别代入式(24)、式(25)可获得采用拉伸应力-应变关系计算强度值(表6)。比对发现,与真实强度误差不超过7%。因此,该关系建立合理,可预测应力-应变关系。
表 6 Mini-SiC/SiC复合材料拉伸应力-应变关系检验过程主要数据Table 6. Main data of the test process of tensile stress-strain relationship of Mini-SiC/SiC compositesName Mini-SiC/
SiC AMini-SiC/
SiC BMaximum load P/N 128.79 132.60 Fracture displacement xmax/mm 0.83 1.03 True strength value σ/MPa 368.72 393.48 Fracture strain εmax 0.0166 0.0205 Strength calculation value of con-
stitutive model/MPa373.50 366.40 Error between calculated value
and real value+1.2% –6.8% 2.4 基体对复合材料强度分散性的影响
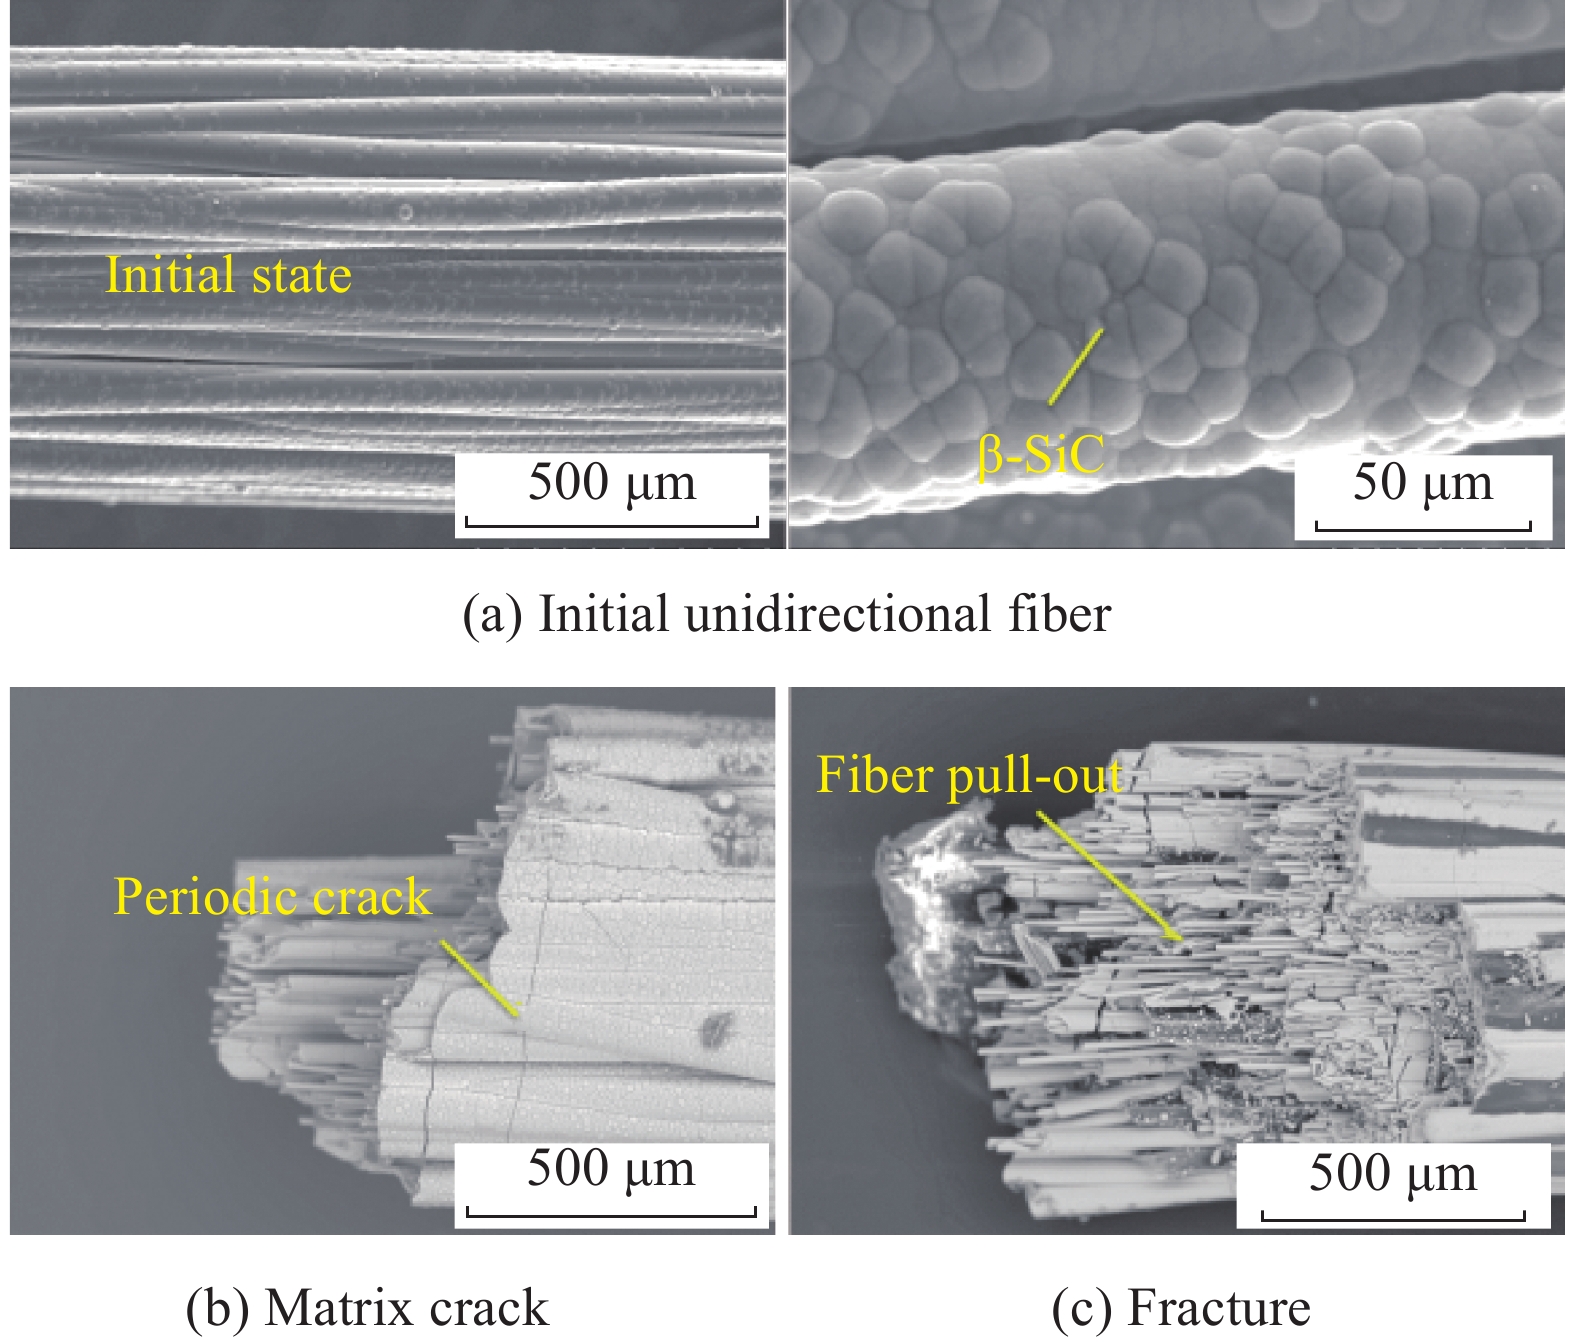
源于CVI工艺的复杂性,故复合材料内部存在缺陷,这些缺陷导致复合材料宏观力学性能具有分散性。图8为Mini-SiC/SiC复合材料初始态与断口SEM图像。图8(a)为初始态单向纤维,可看出纤维束表面沉积基体较粗糙,存在参差不齐菜花状β-SiC,表明基体沉积状态具有不稳定性。由图8(b)、8(c)可见,Mini-SiC/SiC复合材料断口纤维呈纤维单丝形式拔出,基体裂纹未出现大范围偏转,表现瞬间断裂。当纤维束表面存在缺陷时,拉伸过程中会由于应力集中而成为断裂源,造成纤维早期破环,故降低纤维表面缺陷可提高纤维束强度,从而降低强度的分散性。
![]() 图 8 Mini-SiC/SiC复合材料初始态与断口SEM图像Figure 8. SEM images of initial state and fracture of Mini-SiC/SiC composites
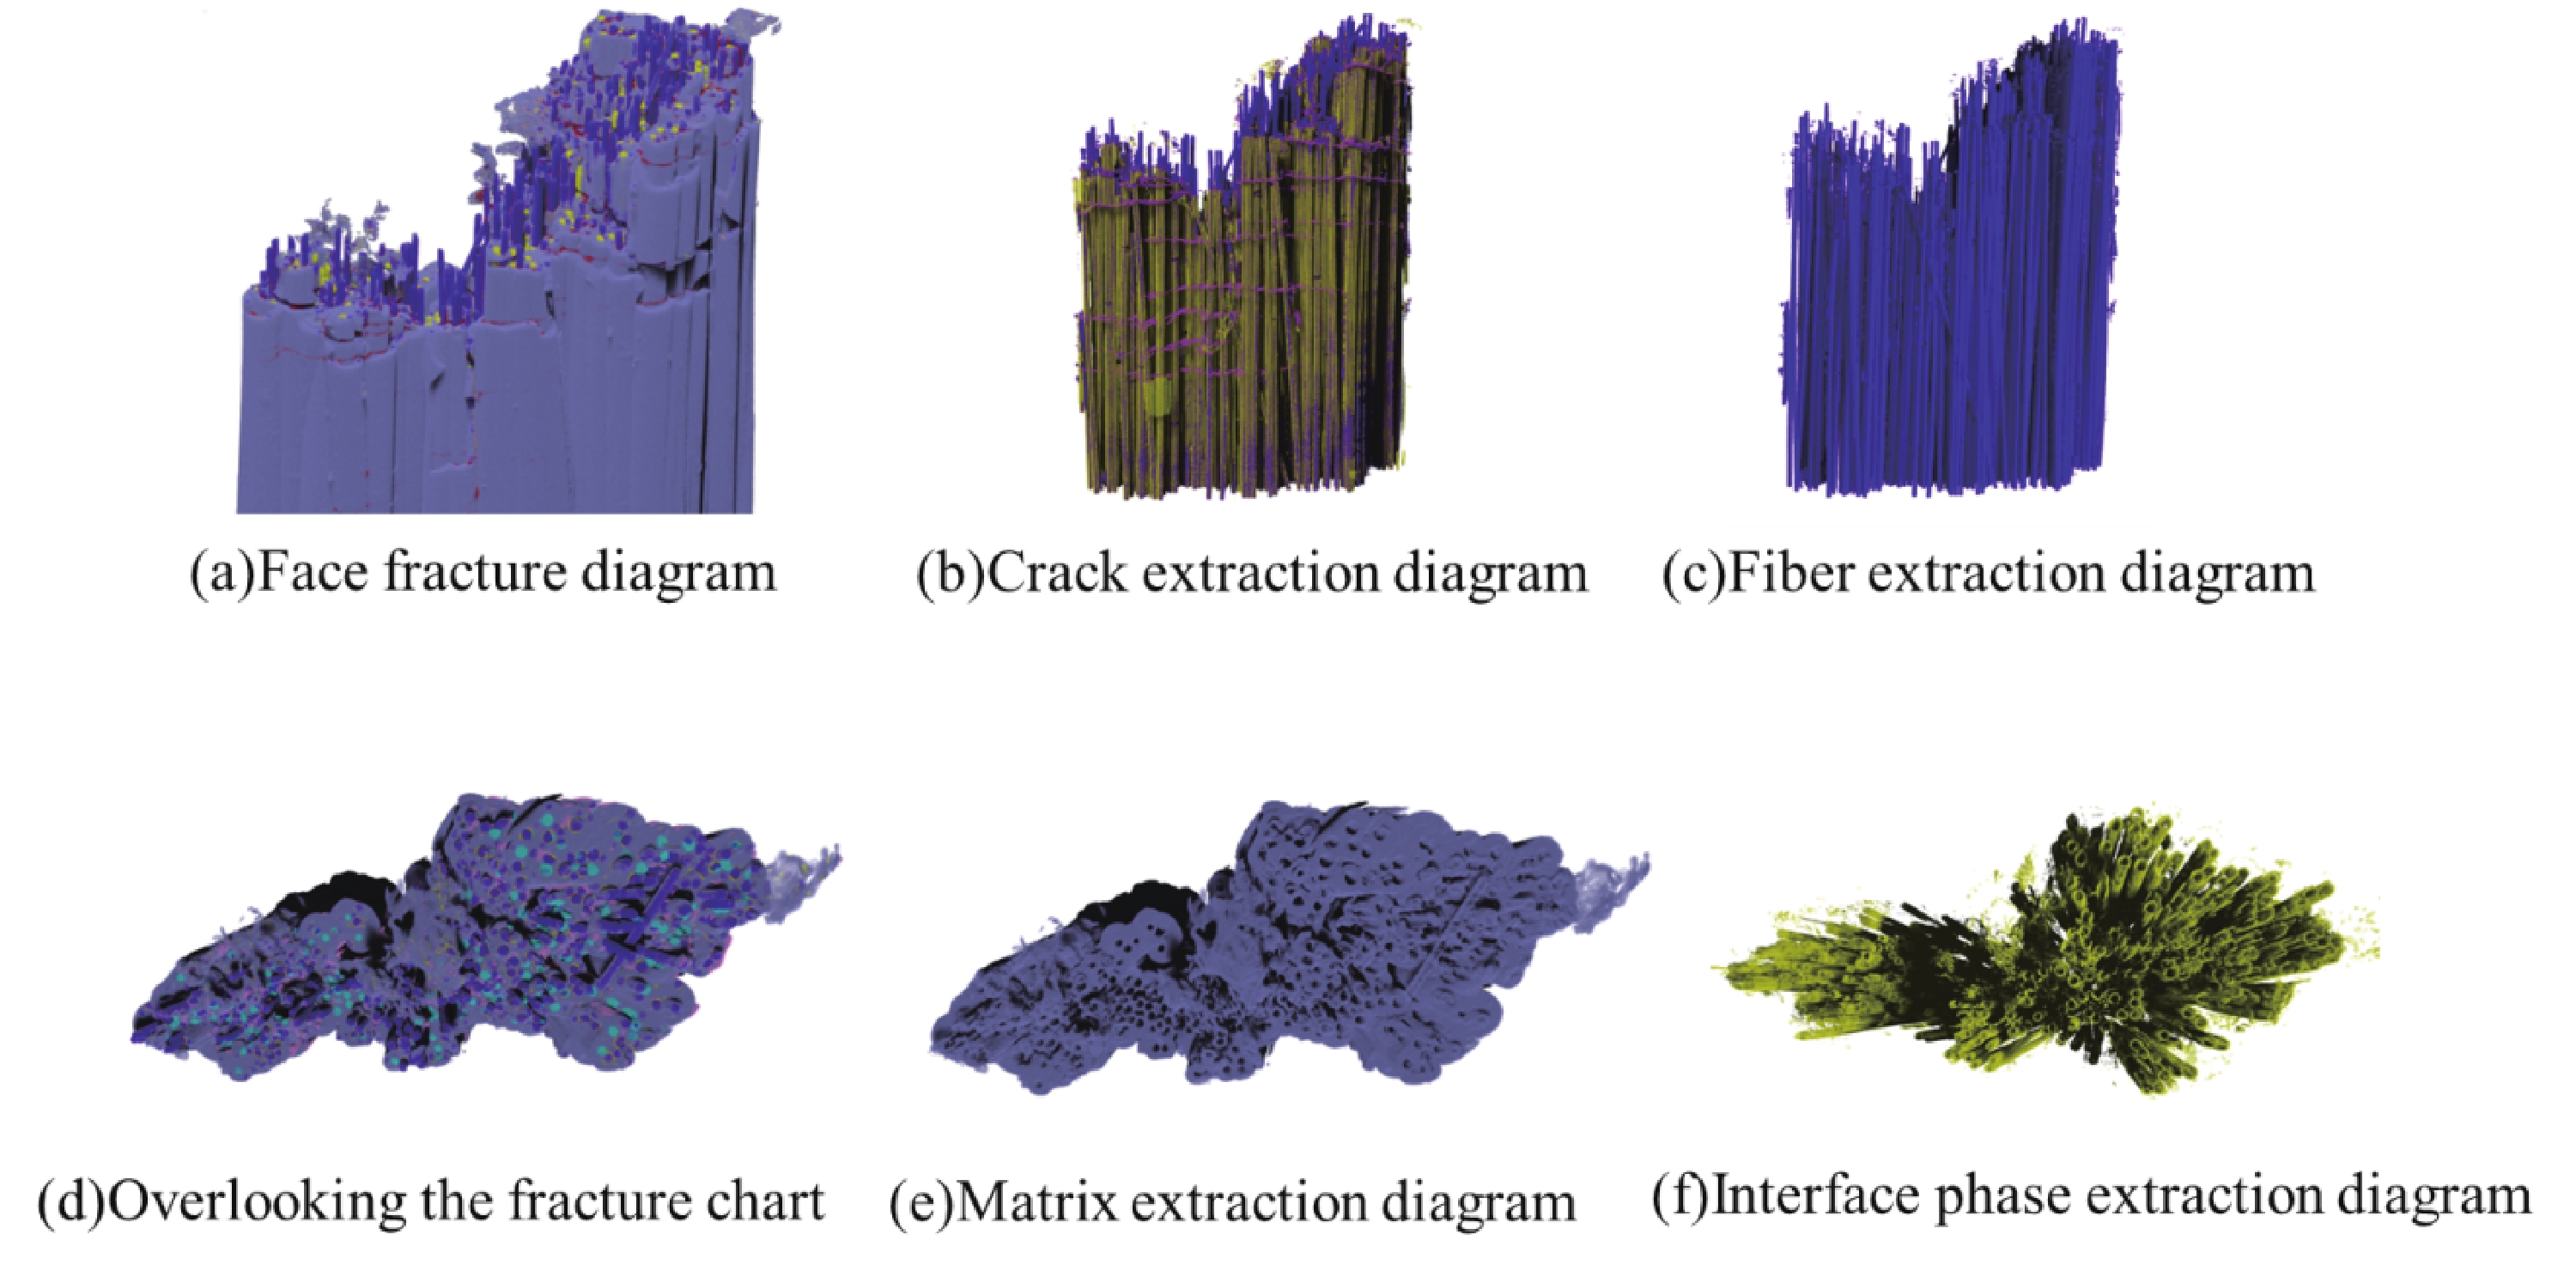
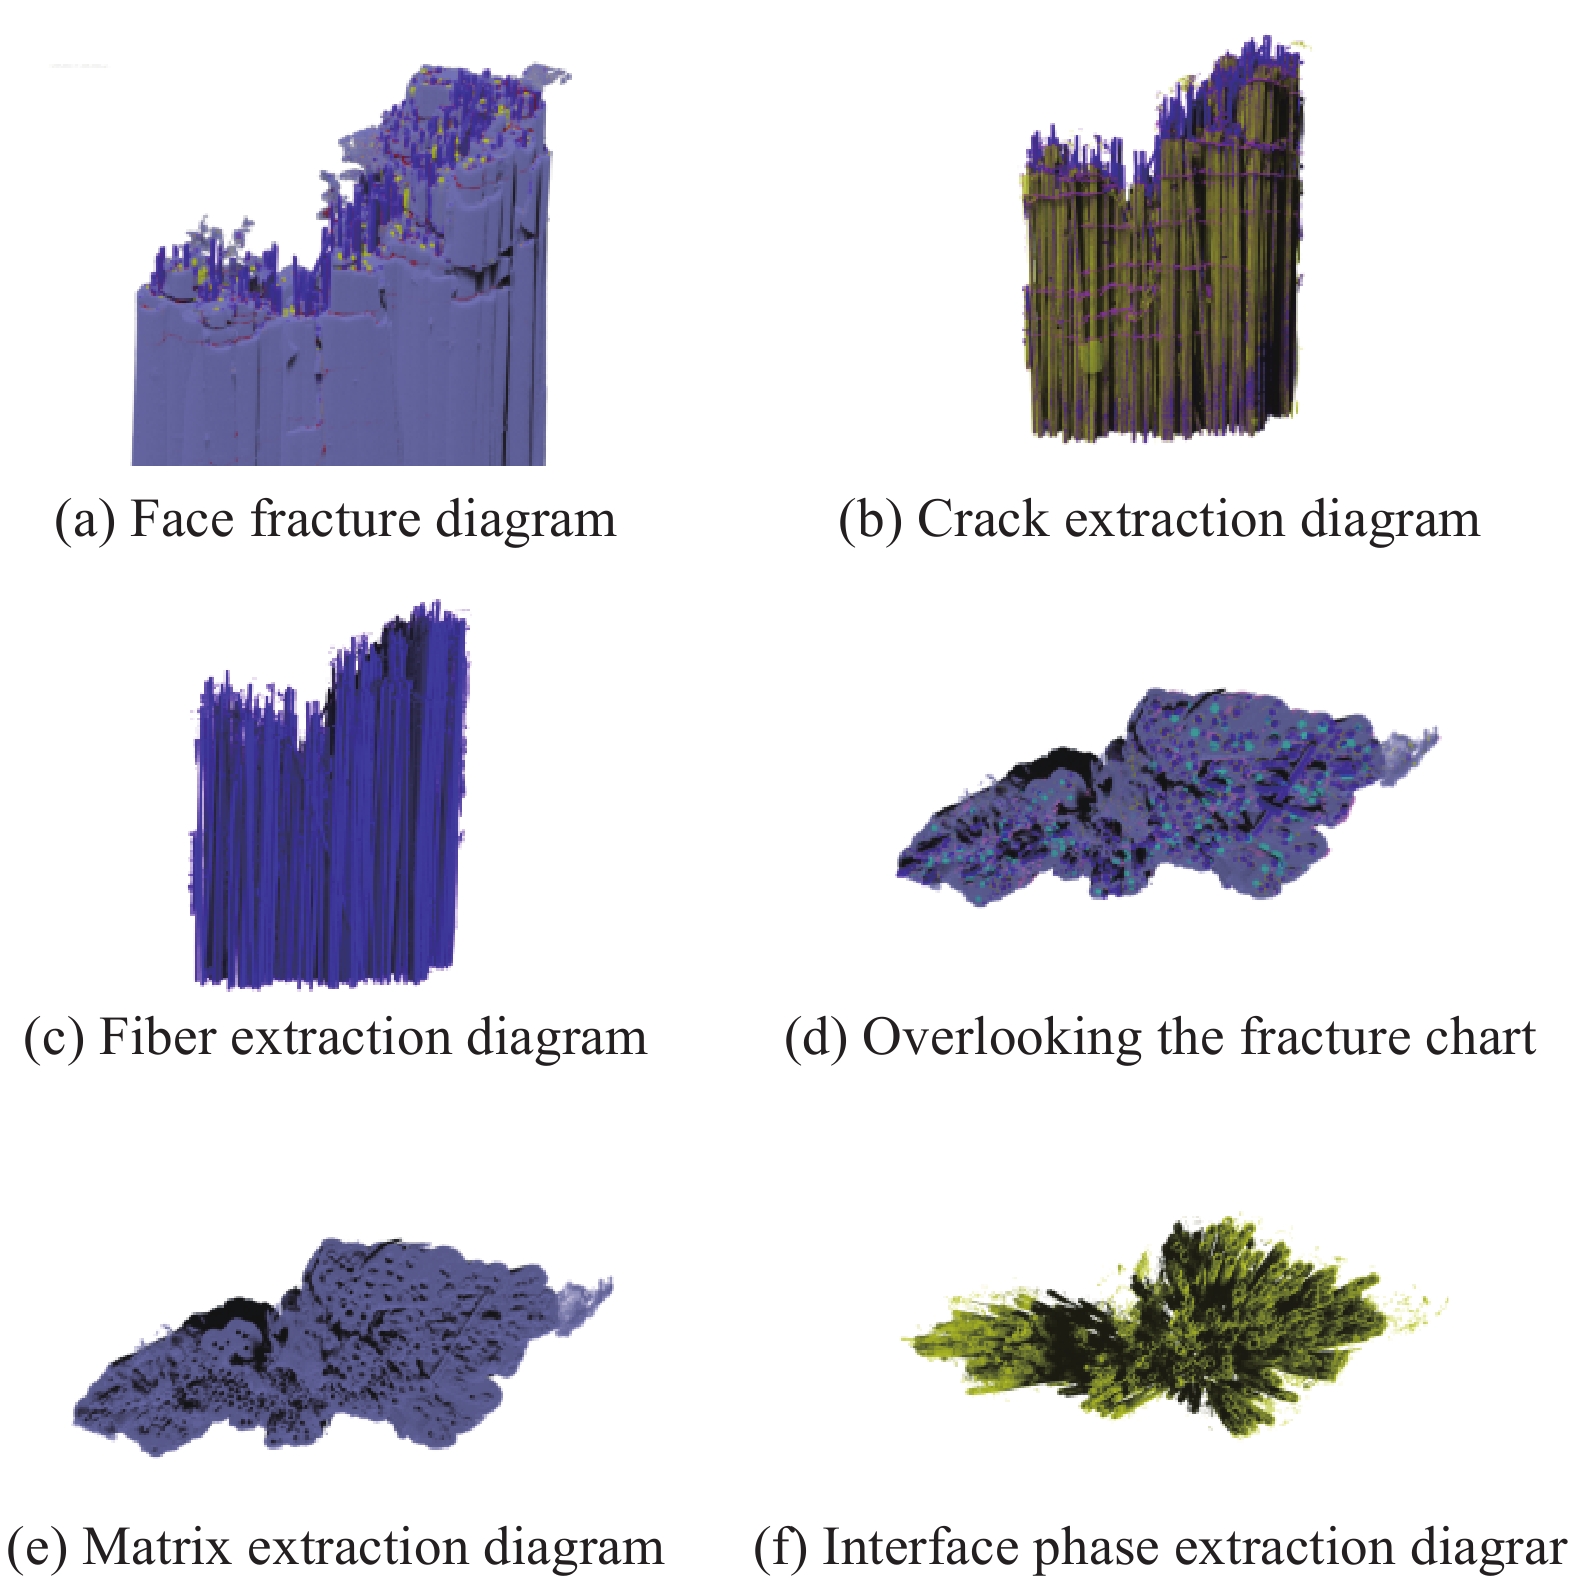
图 8 Mini-SiC/SiC复合材料初始态与断口SEM图像Figure 8. SEM images of initial state and fracture of Mini-SiC/SiC composites图9采用ORS Dragonfly软件对Mini-SiC/SiC复合材料拉断CT图进行处理,图9(a)为初始状态下的正视断口,在阈值分割基础上采用深度学习方法提取拉伸断口裂纹分布(图9(b))情况,其中近似垂直于纤维且相互平行的线条为复合材料周期性裂纹。接着提取SiC纤维(图9(c)),可看出纤维分布并不均匀,纤维少的地方为基体与孔隙填充。随后,对断口俯视角度也进行学习处理(图9(d)),先提取SiC基体(图9(e)),可清楚看到纤维与基体分布状况,证实纤维少的地方由基体填充。最后,提取纤维表面BN界面相(图9(f)),可以看出界面相均匀覆盖纤维表面,形成一根根圆柱管。
![]() 图 9 ORS Dragonfly软件处理Mini-SiC/SiC复合材料断层扫描图像Figure 9. ORS Dragonfly software for processing Mini-SiC/SiC composite tomography images
图 9 ORS Dragonfly软件处理Mini-SiC/SiC复合材料断层扫描图像Figure 9. ORS Dragonfly software for processing Mini-SiC/SiC composite tomography images由图8和图9从Mini-SiC/SiC复合材料宏观表面和分离复合材料内部各组元来看,制备态表面状态与复合材料内部纤维分布情况,会影响界面相与基体分布状态 ,导致复合材料分散性大,影响其可靠性。
复合材料拉伸断裂强度σu如下式所示:
σu=σfuVf (26) 式中:
σfu 为纤维断裂强度;Vf 为纤维体积分数。由式(26)求得理论拉伸强度为499.45 MPa,但由于单向复合材料断裂时,连续纤维(l>30lc)并非同时断裂,下式中载荷传递因子β为0.7,其纤维承载效率大于99%:
σfu=σ∗fu(1−1−βl/lc) (27) 式中:
σ∗fu 为纤维的原位断裂强度;l/lc 为比长度;l为纤维长度;lc为临界纤维长度。此时求得理论拉伸强度为349.61 MPa,该值与实测拉伸强度365.08 MPa相差仅4.24%。表明纤维基本全部承载,纤维对复合材料分散性影响较小。
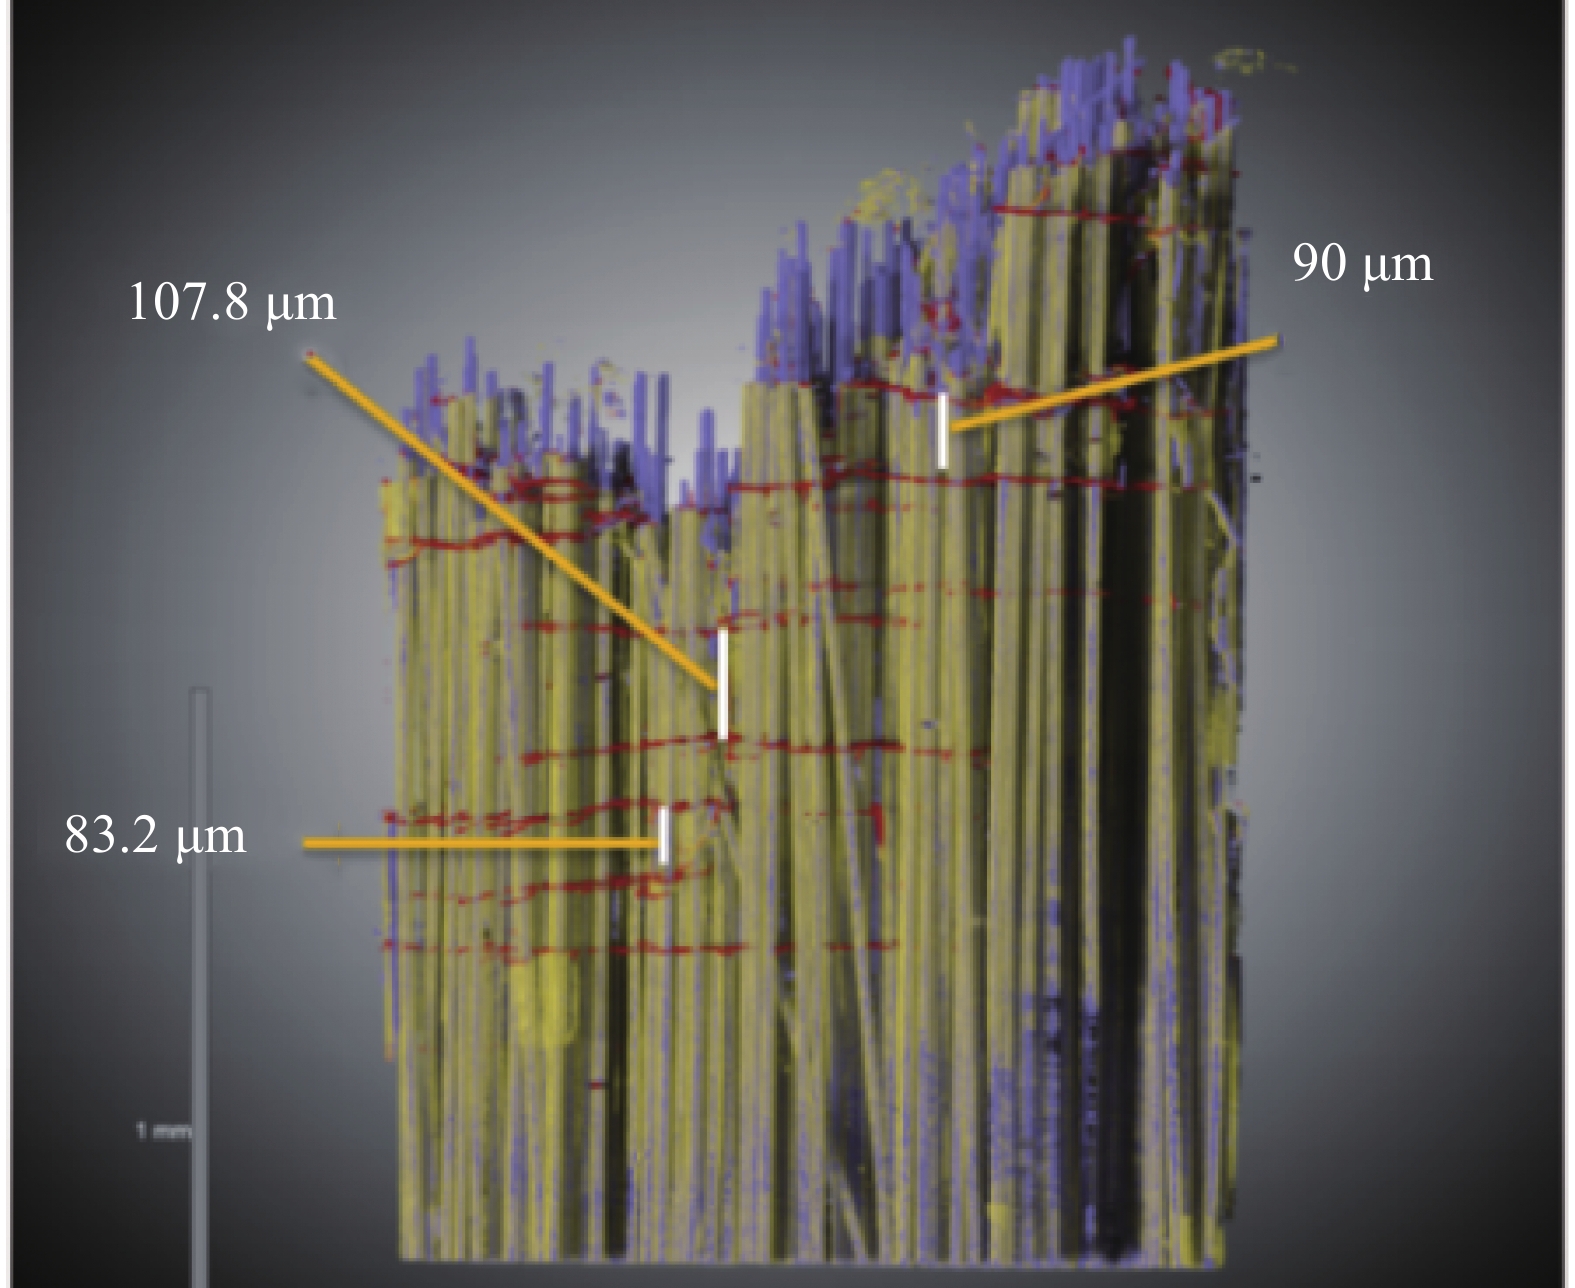
图10对Mini-SiC/SiC复合材料拉伸产生的周期性裂纹间距进行测量,最小裂纹间距为83.2 μm,最大裂纹为107.8 μm。根据图9(f)可知界面相均匀分布,故视界面滑移应力(τ)为定值,不影响复合材料的分散性。由式(28)可计算出(附录表8、表9) Mini-SiC/SiC复合材料基体裂纹宽度为89.43 μm,该宽度处于实际裂纹宽度范围内。验证了该式可以较好地描述Mini-SiC/SiC复合材料力学断裂行为。
![]() 图 10 ORS Dragonfly软件提取Mini-SiC/SiC复合材料周期性裂纹间距图Figure 10. Extraction of periodic crack spacing diagram of Mini-SiC/SiC composites by ORS Dragonfly software
图 10 ORS Dragonfly软件提取Mini-SiC/SiC复合材料周期性裂纹间距图Figure 10. Extraction of periodic crack spacing diagram of Mini-SiC/SiC composites by ORS Dragonfly software将最小与最大裂纹间距代入式(25),分别求出其对应拉伸强度为376.16 MPa和406.14 MPa,该值同样处于该批试样实际拉伸强度(331.02 MPa,407.82 MPa)内,表明基体裂纹间距具有离散性,基体是影响Mini-SiC/SiC复合材料可靠性的主要来源。
ς=b2(1−a1Vf)2Rσp24dτ0EmVf2 (28) 式中:Vf为纤维体积分数;
σp 为峰值应力;R为纤维半径;d为裂纹间距;Em为基体模量。通过双参数Weibull分布模型可知,小试炉与中试炉拟合良好,故裂纹间距仍选用图10。此时中试炉试样拉伸强度(附录表6)范围为(161.09 MPa,540.95 MPa),该范围大于小试炉试样拉伸强度范围,这是由于中试炉沉积基体工艺的放大化所导致,这种现象与m值对应,表明中试炉具有更大离散性(图3)。最大和最小裂纹间距对应的拉伸强度仍处于该范围内。
图11为基体影响复合材料形状参数m与力学性能离散的机制图。根据图9(f)与式(26)、式(27)可知,纤维与界面对复合材料性能离散的影响不大,故基体为影响复合材料可靠性的重要原因。m值影响应力-应变曲线非线性段的平稳性[21],m越大非线性段越平稳,表明复合材料在达到基体最大开裂后曲线越规律,离散性越小。图3与表2可明显看出小试炉制备的复合材料更加稳定,这是由于在小试炉中CVI沉积复合材料基体更加均匀,复合材料孔隙分布集中在内部中心区域(图11(a)),该区域的形成主要原因是基体在沉积时会形成沉积梯度,靠近表层区域的部分复合材料密度大、孔隙被充分填充,致使复合材料内部孔隙无法填充。反观中试炉制备,CVI工艺得到放大,同批次制备试样大大增多,造成复合材料内部孔隙发生不均匀分布现象(图11(b)),进而导致制备出的试样离散性增大、m值减小,影响其可靠性。
![]() 图 11 基体对Mini-SiC/SiC复合材料形状参数m与力学性能离散的影响Figure 11. Matrix effects on the shape parameter m and mechanical property dispersion of Mini-SiC/SiC composites
图 11 基体对Mini-SiC/SiC复合材料形状参数m与力学性能离散的影响Figure 11. Matrix effects on the shape parameter m and mechanical property dispersion of Mini-SiC/SiC composites3. 结 论
(1) 双参数Weibull分布模型可准确表征小试炉制备单向纤维束 SiC/SiC (Mini-SiC/SiC A)、中试炉制备Mini-SiC/SiC B拉伸强度分布,其拉伸强度分别为365.08 MPa和367.78 MPa,形状参数分别为20.59和5.01。
(2) 基于双参数Weibull分布模型建立的可靠度分析模型可准确预测不同可靠度下的可靠强度。其中,当可靠度为50%时,可靠强度与拉伸强度最大误差为1.2%,故在工程中可采用材料的平均拉伸强度预测50%可靠拉伸强度。
(3) 基于双参数Weibull分布模型建立的拉伸载荷-位移关系可准确预测拉伸应力-应变关系,与真实强度误差不超过7%。
(4) 复合材料内部界面相均匀包裹纤维,界面相滑移应力视为定值;连续纤维承载大于99%,纤维对复合材料性能离散性影响较小;通过基体裂纹间距公式可知,最小和最大裂纹间距所对应的拉伸强度为376.16 MPa和406.14 MPa,该值均处于Mini-SiC/SiC A复合材料拉伸强度(331.02 MPa,407.82 MPa)和Mini-SiC/SiC B复合材料拉伸强度(161.09 MPa,540.95 MPa)范围内。然而,Mini-SiC/SiC B复合材料拉伸强度范围大于Mini-SiC/SiC A,且前者 Weibull模数5.01比后者 Weibull模数 20.59低75.7%,中试分散性更大是由于中试炉尺寸放大所致,基体非均匀性是影响复合材料可靠性的主要原因。
-
![]()
图 1 单向纤维束SiC/SiC (Mini-SiC/SiC)复合材料制备示意图
Figure 1. Schematic diagram of preparation of unidirectional fiber bundle SiC/SiC (Mini-SiC/SiC) composites
MTS—Methyltrichlorosilane
![]()
图 3 Mini-SiC/SiC复合材料典型的拉伸载荷-位移曲线
Figure 3. Typical tensile load-displacement curves of Mini-SiC/SiC composites
![]()
图 4 Mini-SiC/SiC复合材料拉伸强度Weibull分布的线性拟合图
Figure 4. Linear fitting diagram of Weibull distribution of tensile strength of Mini-SiC/SiC composites
Fn(σ)—Failure probability; σ—Strength value
![]()
图 5 Mini-SiC/SiC复合材料Weibull累积分布函数曲线与中位估计数据的对比
Figure 5. Weibull cumulative distribution function curve compared with the median estimated data for Mini-SiC/SiC composites
![]()
图 6 Mini-SiC/SiC复合材料断裂位移Weibull分布线性拟合
Figure 6. Linear fitting of Weibull distribution for fracture displacement of Mini-SiC/SiC composites
Da—Cumulative damage factor
![]()
图 7 Mini-SiC/SiC复合材料Weibull累积损伤因子分布函数曲线与中位估计数据的对比
Figure 7. Weibull cumulative damage factor distribution function curves for Mini-SiC/SiC composites compared with median estimated data
![]()
图 8 Mini-SiC/SiC复合材料初始态与断口SEM图像
Figure 8. SEM images of initial state and fracture of Mini-SiC/SiC composites
![]()
图 9 ORS Dragonfly软件处理Mini-SiC/SiC复合材料断层扫描图像
Figure 9. ORS Dragonfly software for processing Mini-SiC/SiC composite tomography images
![]()
图 10 ORS Dragonfly软件提取Mini-SiC/SiC复合材料周期性裂纹间距图
Figure 10. Extraction of periodic crack spacing diagram of Mini-SiC/SiC composites by ORS Dragonfly software
![]()
图 11 基体对Mini-SiC/SiC复合材料形状参数m与力学性能离散的影响
Figure 11. Matrix effects on the shape parameter m and mechanical property dispersion of Mini-SiC/SiC composites
表 1 Mini-SiC/SiC复合材料的制备工艺参数
Table 1 Process parameters of Mini-SiC/SiC composites
Material name Deposition time/h Inside diameter/mm BN interface SiC matrix Mini-SiC/SiC A 100 160 600 Mini-SiC/SiC B 100 160 1200 Notes: Mini-SiC/SiC A—Preparation in a small test furnace (Furnace diameter of 600 mm); Mini-SiC/SiC B—Preparation in a pilot test furnace (Furnace diameter of 1200 mm).  下载: 导出CSV
表 2 两种Mini-SiC/SiC复合材料拉伸强度双参数Weibull分布的参数和线性相关系数
Table 2 Parameters and linear correlation coefficient of two-parameter Weibull distribution for tensile strength of two Mini-SiC/SiC composites
Name Shape parameter b Scale parameter a/mm r Mini-SiC/SiC A 20.59 374.79 0.94 Mini-SiC/SiC B 5.01 400.74 0.98
下载: 导出CSV
表 3 两种Mini-SiC/SiC复合材料在可靠度50%时的可靠拉伸强度与平均拉伸强度
Table 3 Reliable tensile strength and average tensile strength of two Mini-SiC/SiC composites at 50% reliability
Name Mean tensile strength/MPa Tensile strength of 50% reliability/MPa Absolute deviation/MPa Relative deviation/% Mini-SiC/SiC A 365.08 368.18 3.10 0.8 Mini-SiC/SiC B 367.78 372.47 4.69 1.2
下载: 导出CSV
表 4 两种Mini-SiC/SiC复合材料断裂位移双参数Weibull分布参数、线性相关系数
Table 4 Weibull distribution parameters and linear correlation coefficients of two Mini-SiC/SiC composites with two-parameter fracture displacement
Name Shape parameter b Scale parameter a/mm r Mini-SiC/SiC A 3.09 0.87 0.97 Mini-SiC/SiC B 2.50 1.16 0.99
下载: 导出CSV
表 5 Mini SiC/SiC复合材料的DN与D60,0.01、D60,0.05
Table 5 DN and D60,0.01, D60,0.05 of Mini SiC/SiC composites
Name DN D60,0.01 D60,0.05 Mini-SiC/SiC A 0.1139 0.2104 0.1756 Mini-SiC/SiC B 0.1036 0.2104 0.1756 Notes: DN—Kolmogorov distance; D60,0.01—Total sample size is 60 and the significance level α is taken as 0.01; D60,0.05—Total sample size is 60 and α is taken as 0.05.
下载: 导出CSV
表 6 Mini-SiC/SiC复合材料拉伸应力-应变关系检验过程主要数据
Table 6 Main data of the test process of tensile stress-strain relationship of Mini-SiC/SiC composites
Name Mini-SiC/
SiC AMini-SiC/
SiC BMaximum load P/N 128.79 132.60 Fracture displacement xmax/mm 0.83 1.03 True strength value σ/MPa 368.72 393.48 Fracture strain εmax 0.0166 0.0205 Strength calculation value of con-
stitutive model/MPa373.50 366.40 Error between calculated value
and real value+1.2% –6.8%
下载: 导出CSV
-
[1] 焦健, 陈明伟. 新一代发动机高温材料—陶瓷基复合材料的制备、性能及应用[J]. 航空制造技术, 2014, 451(7):62-69. DOI: 10.3969/j.issn.1671-833X.2014.07.007 JIAO Jian, CHEN Mingwei. New generation of high-temperature material for engine—Preparation, property and application of ceramic matrix composites[J]. Aviation Manufacturing Technology,2014,451(7):62-69(in Chinese). DOI: 10.3969/j.issn.1671-833X.2014.07.007
[2] 张立同, 成来飞. 连续纤维增韧陶瓷基复合材料可持续发展战略探讨[J]. 复合材料学报, 2007, 24(2):1-6. ZHANG Litong, CHENG Laifei. Discussion on strategies of sustainable development of continuous fiber reinforced ceramic matrix composites[J]. Acta Materiae Compositae Sinica,2007,24(2):1-6(in Chinese).
[3] 左平, 何爱杰, 李万福, 等. 连续纤维增韧陶瓷基复合材料的发展及在航空发动机上的应用[J]. 燃气涡轮试验与研究, 2019, 32(5):47-52. ZUO Ping, HE Aijie, LI Wanfu, et al. Application of continuous fiber reinforced ceramic matrix composites on aero-engine[J]. Gas Turbine Experiment and Research,2019,32(5):47-52(in Chinese).
[4] 陈明伟, 谢巍杰, 邱海鹏. 连续碳化硅纤维增强碳化硅陶瓷基复合材料研究进展[J]. 现代技术陶瓷, 2016, 37(6):393-402. CHEN Mingwei, XIE Weijie, QIU Haipeng. Continuous silicon carbide fiber reinforced silicon carbide ceramic based research progress of composite materials[J]. Advanced Ceramics,2016,37(6):393-402(in Chinese).
[5] 于新民, 周万城, 罗发, 等. SiC/SiC复合材料的力学性能[J]. 航空材料学报, 2009, 29(3):93-97. YU Xinmin, ZHOU Wancheng, LUO Fa, et al. Mechanical properties of SiC/SiC composites[J]. Journal of Aeronautical Materials,2009,29(3):93-97(in Chinese).
[6] 邹芹, 周鑫, 李艳国, 等. SiC复合材料的研究进展与展望[J]. 中南大学学报(自然科学版), 2020, 51(11):3220-3232. ZOU Qin, ZHOU Xin, LI Yanguo, et al. Research progress and prospect of SiC composites[J]. Journal of Central South University (Science and Technology),2020,51(11):3220-3232(in Chinese).
[7] 高魁垠, 李海波, 吴建国, 等. 2D-C/SiC复合材料螺栓连接结构可靠性分析[J]. 强度与环境, 2020, 47(1):33-40. GAO Kuiyin, LI Haibo, WU Jianguo, et al. Reliability analysis of 2D-C/SiC composite bolted joints[J]. Structure & Environment Engineering,2020,47(1):33-40(in Chinese).
[8] 郭飞, 费庆国, 李彦斌, 等. 基于Weibull模型的C/C复合材料销钉剪切强度分布及本构关系[J]. 复合材料学报, 2019, 36(2):461-468. GUO Fei, FEI Qingguo, LI Yanbin, et al. Shear strenght distribution and constitutive model of C/C composite pins based on Weibull model[J]. Acta Materiae Compositae Sinica,2019,36(2):461-468(in Chinese).
[9] 石多奇, 沙景恬, 程震, 等. SiC/SiC mini复合材料拉伸性能分散性的数值仿真方法[J]. 航空动力学报, 2019, 34(5):971-979. SHI Duoqi, SHA Jingtian, CHENG Zhen, et al. Numerical simulation method of the variability in tensile properties of SiC/SiC minicomposites[J]. Journal of Aerospace Power,2019,34(5):971-979(in Chinese).
[10] 袁建宇, 逄锦程, 王影, 等. C/SiC复合材料螺钉拉伸强度分布模型[J]. 宇航材料工艺, 2019, 49(5):74-78. YUAN Jianyu, PANG Jincheng, WANG Ying, et al. Tensile strength distribution model of C/SiC composite material bolts[J]. Aerospace Materials & Technology,2019,49(5):74-78(in Chinese).
[11] 李湘郡, 李彦斌, 郭飞, 等. C/C复合材料的压缩强度分布与可靠性评估[J]. 航空学报, 2019, 40(8):122-130. LI Xiangjun, LI Yanbin, GUO Fei, et al. Compression strength distribution and reliability assessment of C/C composites[J]. Acta Aeronautica et Astronautica Sinica,2019,40(8):122-130(in Chinese).
[12] 韩旭旭, 张程煜, 陈博, 等. 2D-SiCf/SiC复合材料抗拉强度统计分布规律[J]. 复合材料学报, 2019, 36(2):434-440. HAN Xuxu, ZHANG Chengyu, CHEN Bo, et al. Statistical distribution of tensile strength of a 2D-SiCf/SiC composite[J]. Acta Materiae Compositae Sinica,2019,36(2):434-440(in Chinese).
[13] 李辉, 张立同, 曾庆丰, 等. 2D C/SiC复合材料的可靠性评价[J]. 复合材料学报, 2007, 24(4):95-100. DOI: 10.3321/j.issn:1000-3851.2007.04.017 LI Hui, ZHANG Litong, ZENG Qingfeng, et al. Reliability analysis of 2D C/SiC composite[J]. Acta Materiae Compositae Sinica,2007,24(4):95-100(in Chinese). DOI: 10.3321/j.issn:1000-3851.2007.04.017
[14] 陶永强, 矫桂琼, 王波, 等. 2D编织陶瓷基复合材料应力-应变行为: 分析预测[J]. 工程力学, 2009, 26(10):221-227. TAO Yongqiang, JIAO Guiqiong, WANG Bo, et al. Stress-strain behavior in 2D weave ceramic matrix composite: Analysis predictions[J]. Engineering Mechanics,2009,26(10):221-227(in Chinese).
[15] CURTIN W A, AHN B K, TAKEDA N. Modeling brittle and tough stress-strain behavior in unidirectional ceramic matrix composites[J]. Acta Materialia,1998,46(10):3409-3420. DOI: 10.1016/S1359-6454(98)00041-X
[16] 孟志新, 常柯, 郭旭, 等. 不同纤维束下SiC陶瓷基复合材料拉伸强度及拉伸行为研究[J]. 西安航空学院学报, 2019, 37(5):35-42. MENG Zhixin, CHANG Ke, GUO Xu, et al. Study on tensile strenght and tensile behavior of SiC ceramic matrix composites under different fiber bundles[J]. Journal of Xi'an Aeronautical University,2019,37(5):35-42(in Chinese).
[17] VAGAGGINI E, DOMERGUE J, EVANS A G. Relationships between hysteresis measurements and the constituent properties of ceramic matrix composites: I, theory[J]. Journal of the American Ceramic Society,1995,78(10):2709-2720. DOI: 10.1111/j.1151-2916.1995.tb08046.x
[18] MA X, YIN X, CAO X, et al. Effect of heat treatment on the mechanical properties of SiCf/BN/SiC fabricated by CVI[J]. Ceramics International,2016,42(2):3652-3658. DOI: 10.1016/j.ceramint.2015.11.030
[19] 中国国家标准化管理委员会. 单向纤维增强复合材料的力学性能: GB/T 1040.5—2008[S]. 北京: 中国标准出版社, 2008. Standardization Administration of the People's Republic of China. Mechanical properties of unidirectional fiber-reinforced composites: GB/T 1040.5—2008[S]. Beijing: China Standards Press, 2005(in Chinese).
[20] GAO X Y, LEI B, ZHANG Y, et al. Identification of microstructures and damages in silicon carbide ceramic matrix composites by deep learning[J]. Materials Characterization,2023,196:112608. DOI: 10.1016/j.matchar.2022.112608
[21] 李潘. 二维编织SiC/SiC复合材料本构研究[D]. 西安: 西北工业大学, 2014. LI Pan. The constitutive relation of 2D woven SiC/SiC composites[D]. Xi'an: Northwestern Polytechnical University, 2014(in Chinese).
-
期刊类型引用(1)
1. 李新娅,王宁,卢佳浩,张鹏,夏兆鹏,侯耒. 基于改进Weibull模型的高强缝合锚钉缝线强度预测. 现代纺织技术. 2024(06): 52-60 .  百度学术
百度学术
其他类型引用(1)
-
Objectives
Continuous silicon carbide fiber toughened silicon carbide ceramic matrix composites (SiC/SiC) are characterized by high strength, high temperature resistance and low density, and are internationally recognized as one of the preferred materials for new aero-engines. The material preparation process can lead to non-uniform characteristics in its microstructure, such as pores inside and outside the bundle, delamination, preform lay-up misalignment and matrix cracking, making its properties more discrete. When designing a structure with strength as the main parameter, the structural reliability is limited by its dispersion. The composites are already at the stage of scaled-up engineering applications, and the manufacturing equipment will increase the inhomogeneity of the microstructure, leading to even more significant dispersion in its mechanical properties.
MethodsIn this paper, two batches of unidirectional fiber bundle SiC/SiC composites (Mini-SiC/SiC) were prepared by chemical vapor infiltration (CVI) in a small pilot furnace and a pilot furnace to investigate the effect of process scale-up on the dispersion of the mechanical properties of the composites and to discuss the sources of dispersion in the mechanical properties of the composites. The strength distribution and reliability of the Mini-SiC/SiC composites were analyzed by a two-parameter Weibull distribution model, and a tensile load-displacement relationship was established based on the two-parameter Weibull distribution damage model. The final partitioning of the components by ORS Dragonfly software was used to analyze the effect of dispersion on reliability in conjunction with the matrix spacing crack equation.
ResultsThe two-parameter Weibull distribution and the median estimated distribution were used to analyze the strength distribution pattern and reveal the dispersion based on the deep learning of the microstructure of each component (matrix, interfacial phase and fiber) of this composites. The results show that: (i) the two-parameter Weibull distribution model can accurately characterize the tensile strength distribution of Mini-SiC/SiC A and Mini-SiC/SiC B, and their tensile strengths The tensile strengths of Mini-SiC/SiC A and Mini-SiC/SiC B were 365.08 MPa and 367.78 MPa, respectively, and the shape parameters were 20.59 and 5.01, respectively. ii) The reliability analysis model based on the two-parameter Weibull distribution model can accurately predict the reliability strengths at different reliability levels. Among them, when the reliability is 50%, the maximum error between the reliable strength and the tensile strength is 1.2%, so the average tensile strength of the material can be used to predict the 50% reliable tensile strength in engineering. ③The tensile load-displacement relationship established based on the two-parameter Weibull distribution model can accurately predict the tensile stress-strain relationship, with an error of no more than 7% from the true strength. (iv) The interfacial phase inside the composites is uniformly wrapped with fibers, and the interface phase slip stress is regarded as a constant value; the continuous fiber bearing is greater than 99%, and the fiber has less influence on the discrete properties of the composites; the tensile strengths corresponding to the minimum and maximum crack spacing are 376.16 MPa and 406.14 MPa, which are both in the small test Mini-SiC/SiC composite tensile strengths (331.02 MPa, 407.14 MPa), as shown by the matrix crack spacing equation (331.02 MPa, 407.82 MPa) and the tensile strengths of the pilot test (161.09 MPa, 540.95 MPa). However, the range of tensile strengths of the Mini-SiC/SiC composites in the pilot test was greater than that of the small test furnace, and the Weibull modulus of 5.01 was 75.7% lower than that of 20.59 in the pilot test, with greater dispersion in the pilot test.Conclusions: The tensile strengths of unidirectional fiber bundles of SiC/SiC prepared in the small and pilot furnaces were located at (331.02 MPa, 407.82 MPa) and (161.09 MPa, 540.95 MPa), respectively; the former Weibull modulus (20.59) was 75.7% higher than the latter (5.01), indicating increased dispersion in the pilot test. The results of deep learning of fracture morphology showed that matrix cracking, interface deflection and fiber fracture pull-out were the main failure mechanisms, and quantitative analysis yielded a matrix crack spacing distribution of (83.2 μm, 107.8 μm), which was calculated by the fine-scale mechanical equation to show that matrix non-uniformity was the main reason for the reliability of the composites.
-
连续碳化硅纤维增韧碳化硅陶瓷基复合材料(SiC/SiC)具备高强度、耐高温、低密度等特点,是国际公认的新型航空发动机优选材料之一。该材料制备工艺会导致其微结构存在非均匀特征,如束内外孔隙、分层、预制体铺层错位和基体开裂等,使其性能离散性较大。以强度为主要参数进行结构设计时,会受其离散性影响限制结构可靠性。该复材已处于工程放大应用阶段,生产制造设备放大会提高微结构的不均匀性,导致其力学性能离散性更显著。本文通过小试炉与中试炉分别制备单向纤维束SiC/SiC(Mini-SiC/SiC)复合材料,评估其拉伸强度可靠性,基于深度学习工具ORS Dragonfly提取微结构特征(基体、裂纹、界面相、纤维),结合纤维强度和基体间距裂纹公式分析离散性。结果表明:复材基体裂纹间距为(83.2μm,107.8μm),体现了制备工艺的影响;界面相均匀包裹每根纤维,界面相滑移应力视为定值;连续纤维承载大于99%,纤维对复材性能离散性影响较小;根据拉伸强度与基体裂纹间距公式,计算得出最小和最大裂纹间距所对应的拉伸强度值分别为376.16和406.14MPa,该值都处于小试Mini-SiC/SiC复材拉伸强度(331.02MPa,407.82MPa)和中试复材拉伸强度(161.10MPa,540.95MPa)范围内。然而,中试Mini-SiC/SiC复材拉伸强度范围大于小试炉,且前者威布尔模数5.01比后者威布尔模数20.59低75.7%,中试分散性更大是由于中试炉尺寸放大所致,基体非均匀性是影响复材可靠性的主要原因。
ORS Dragonfly软件处理Mini-SiC/SiC复合材料CT图。


计量
- 文章访问数: 1008
- HTML全文浏览量: 329
- PDF下载量: 116
- 被引次数: 2
